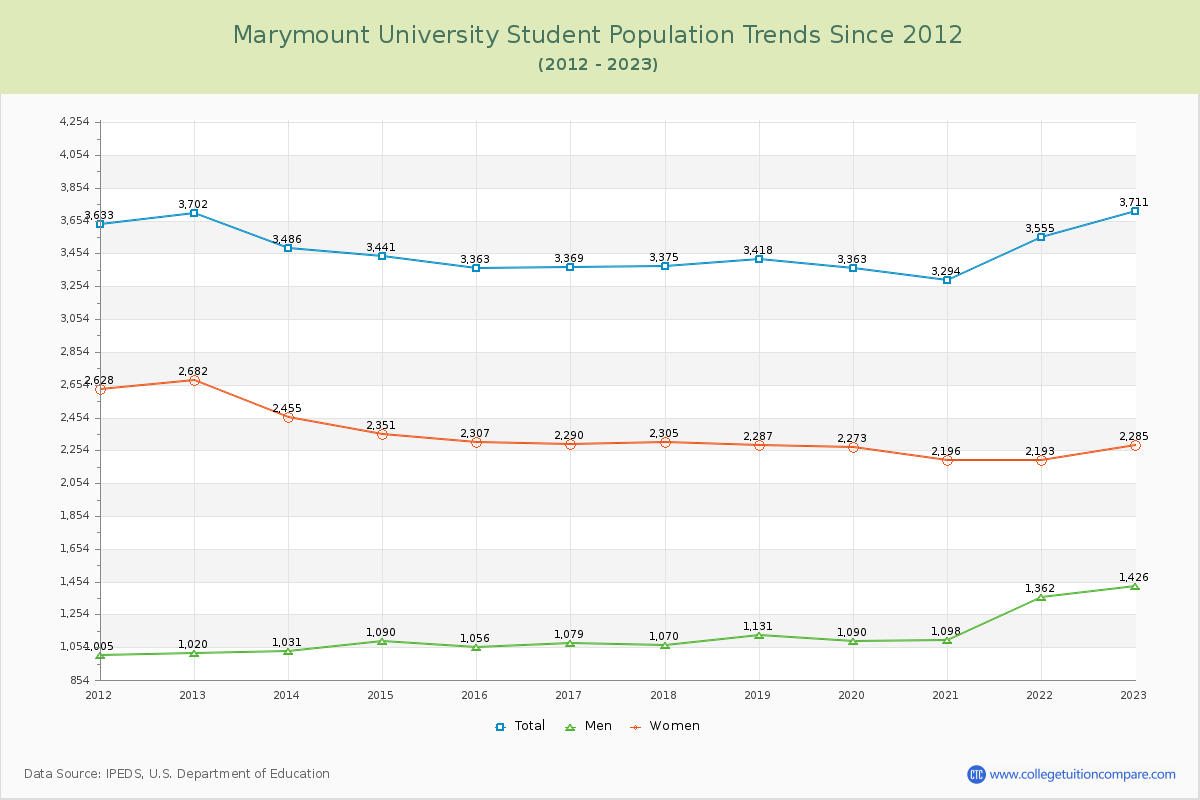
Student Population Changes
The average student population over the last 12 years is 3,462 where 3,711 students are attending the school for the academic year 2022-2023.
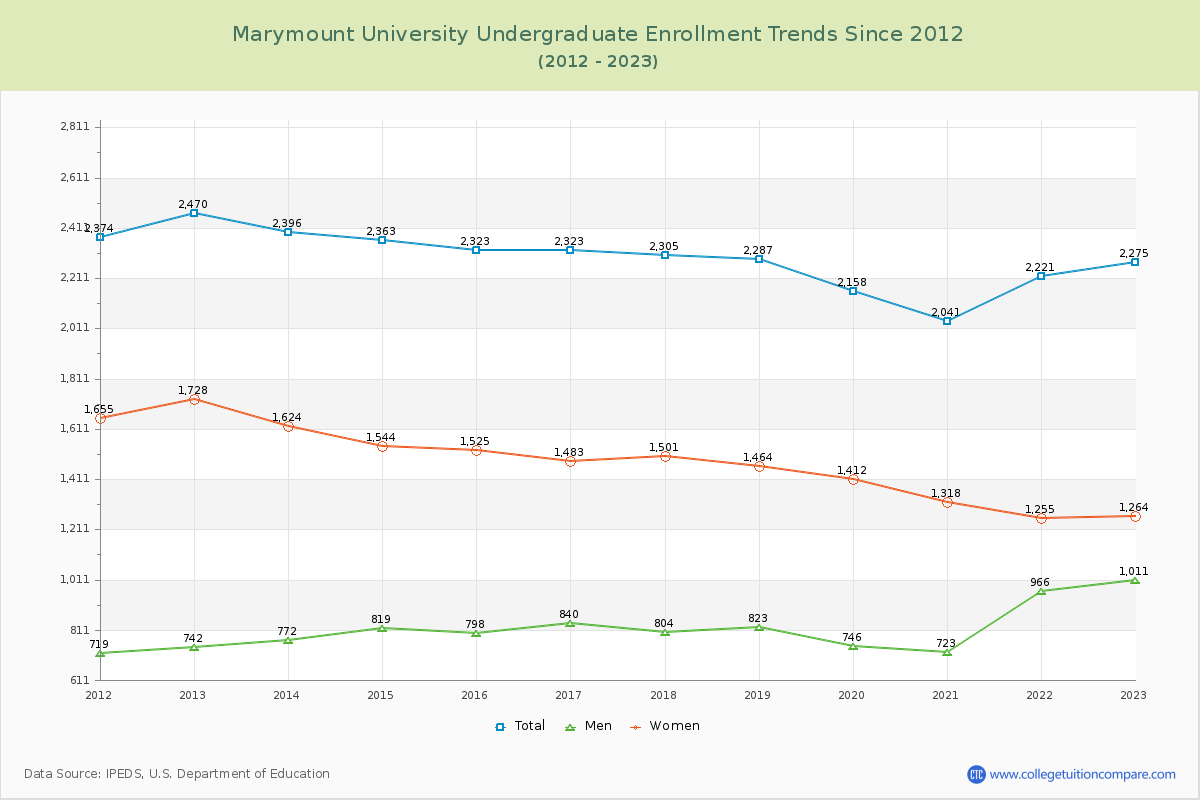
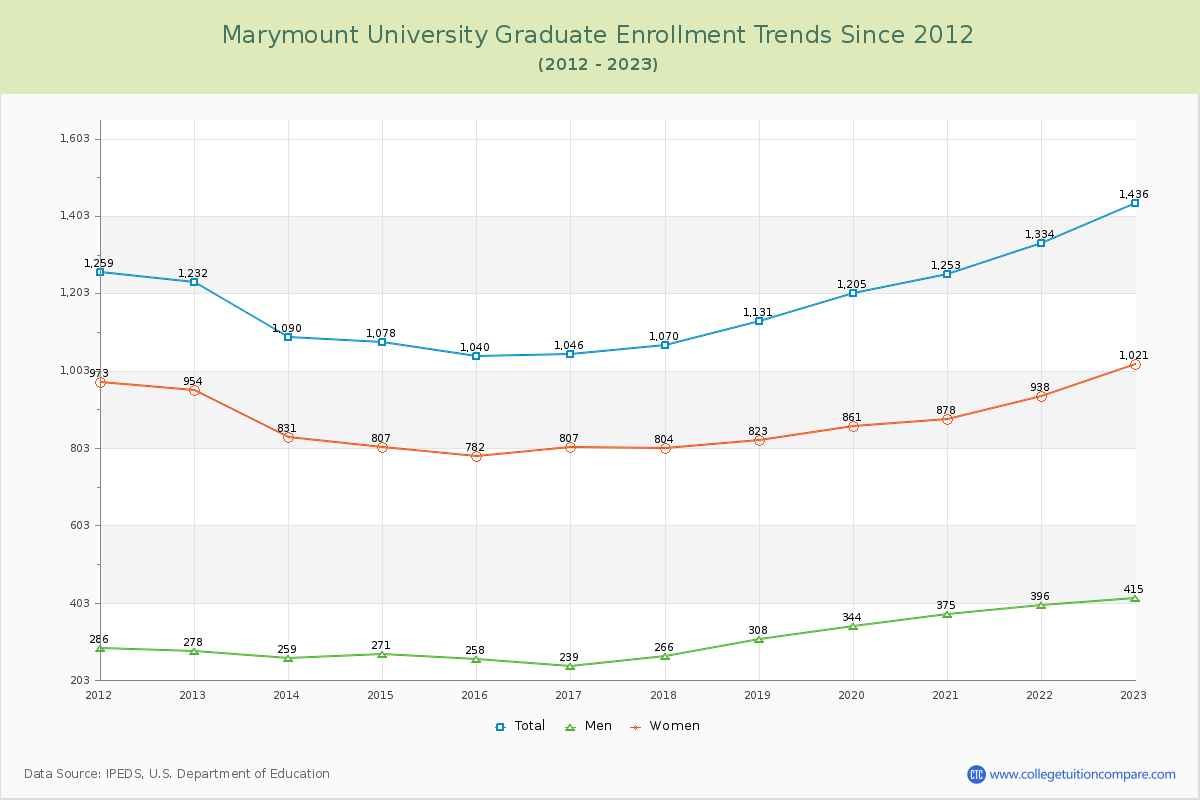
61.30% of total students is undergraduate students and 38.70% students is graduate students. The number of undergraduate students has decreased by 195 and the graduate enrollment has increased by 204 over past 10 years.
The female to male ratio is 1.60 to 1 and it means that there are more female students enrolled in Marymount than male students.
The following table and chart illustrate the changes in student population by gender at Marymount University since 2012.
| Year | Total | Undergraduate | Graduate | ||||
|---|---|---|---|---|---|---|---|
| Total | Men | Women | Total | Men | Women | ||
| 2012-13 | 3,702 | 2,470 | 742 | 1,728 | 1,232 | 278 | 954 |
| 2013-14 | 3,486 -216 | 2,396 -74 | 772 30 | 1,624 -104 | 1,090 -142 | 259 -19 | 831 -123 |
| 2014-15 | 3,441 -45 | 2,363 -33 | 819 47 | 1,544 -80 | 1,078 -12 | 271 12 | 807 -24 |
| 2015-16 | 3,363 -78 | 2,323 -40 | 798 -21 | 1,525 -19 | 1,040 -38 | 258 -13 | 782 -25 |
| 2016-17 | 3,369 6 | 2,323 0 | 840 42 | 1,483 -42 | 1,046 6 | 239 -19 | 807 25 |
| 2017-18 | 3,375 6 | 2,305 -18 | 804 -36 | 1,501 18 | 1,070 24 | 266 27 | 804 -3 |
| 2018-19 | 3,418 43 | 2,287 -18 | 823 19 | 1,464 -37 | 1,131 61 | 308 42 | 823 19 |
| 2019-20 | 3,363 -55 | 2,158 -129 | 746 -77 | 1,412 -52 | 1,205 74 | 344 36 | 861 38 |
| 2020-21 | 3,294 -69 | 2,041 -117 | 723 -23 | 1,318 -94 | 1,253 48 | 375 31 | 878 17 |
| 2021-22 | 3,555 261 | 2,221 180 | 966 243 | 1,255 -63 | 1,334 81 | 396 21 | 938 60 |
| 2022-23 | 3,711 156 | 2,275 54 | 1,011 45 | 1,264 9 | 1,436 102 | 415 19 | 1,021 83 |
| Average | 3,462 | 2,287 | 822 | 1,465 | 1,174 | 310 | 864 |