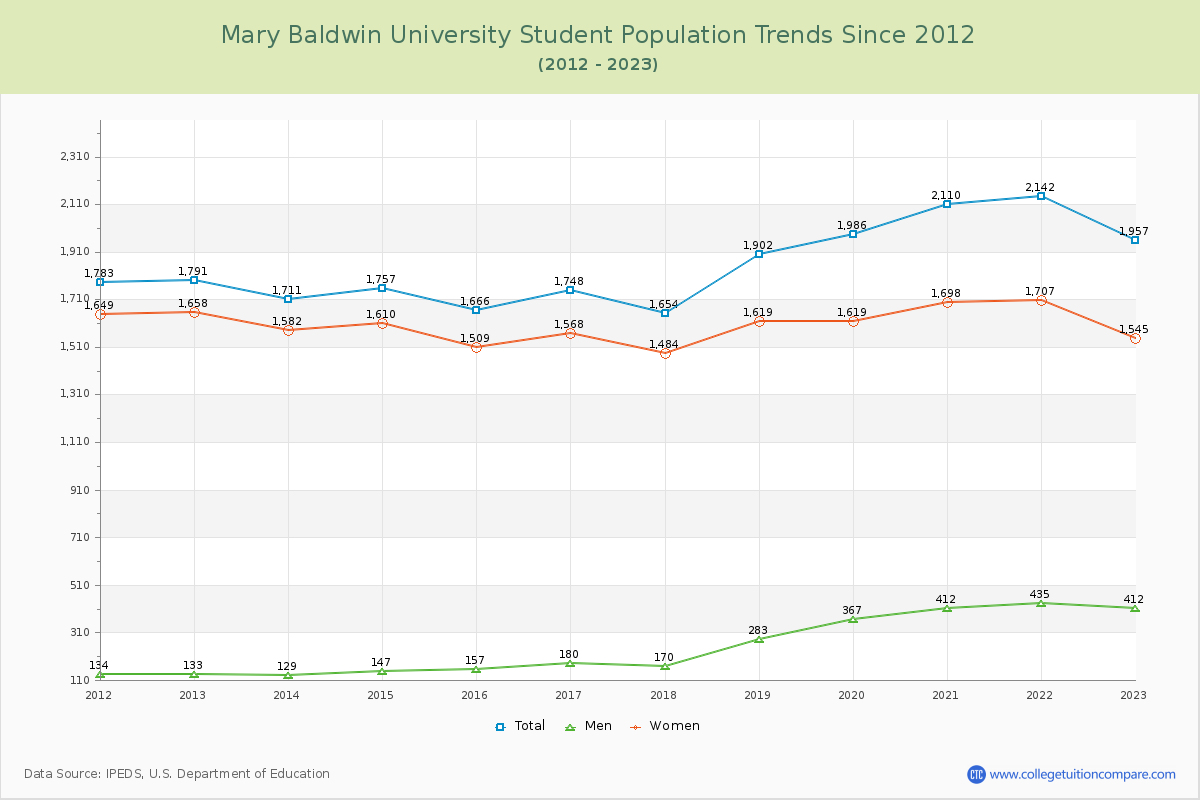
Student Population Changes
The average student population over the last 12 years is 1,857 where 1,957 students are attending the school for the academic year 2022-2023.
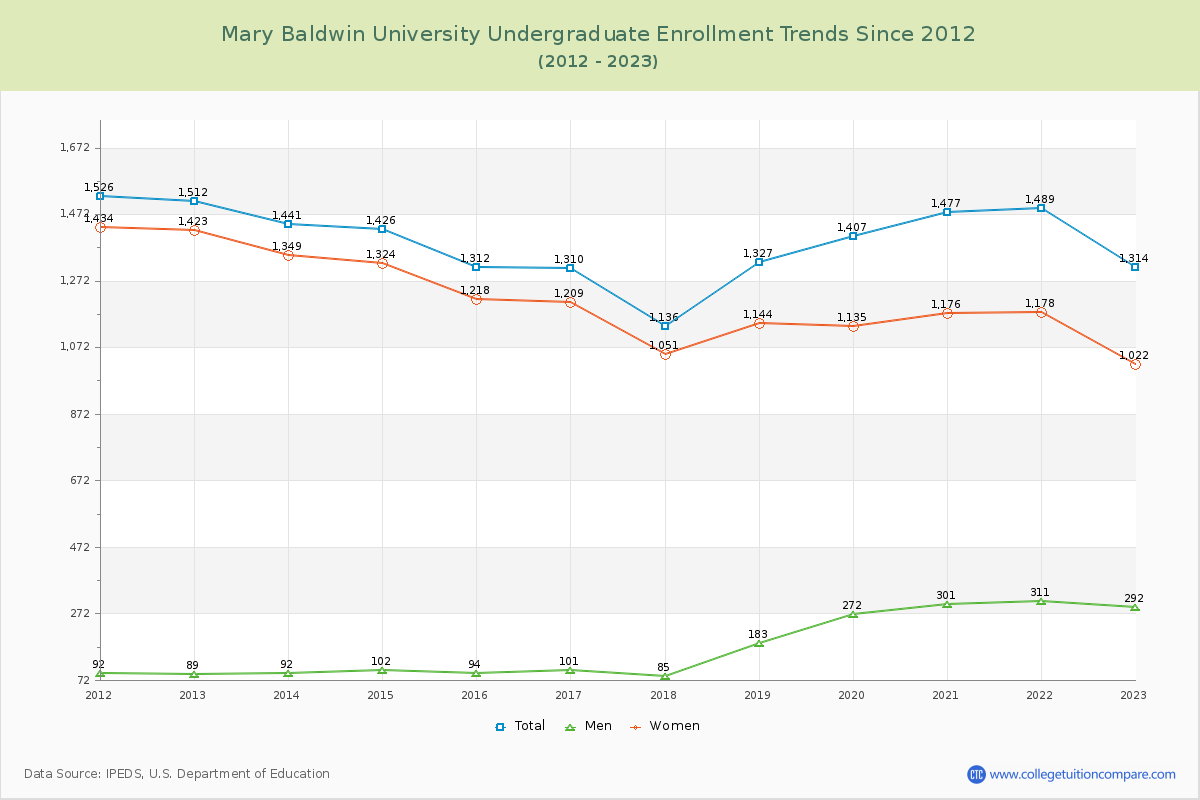
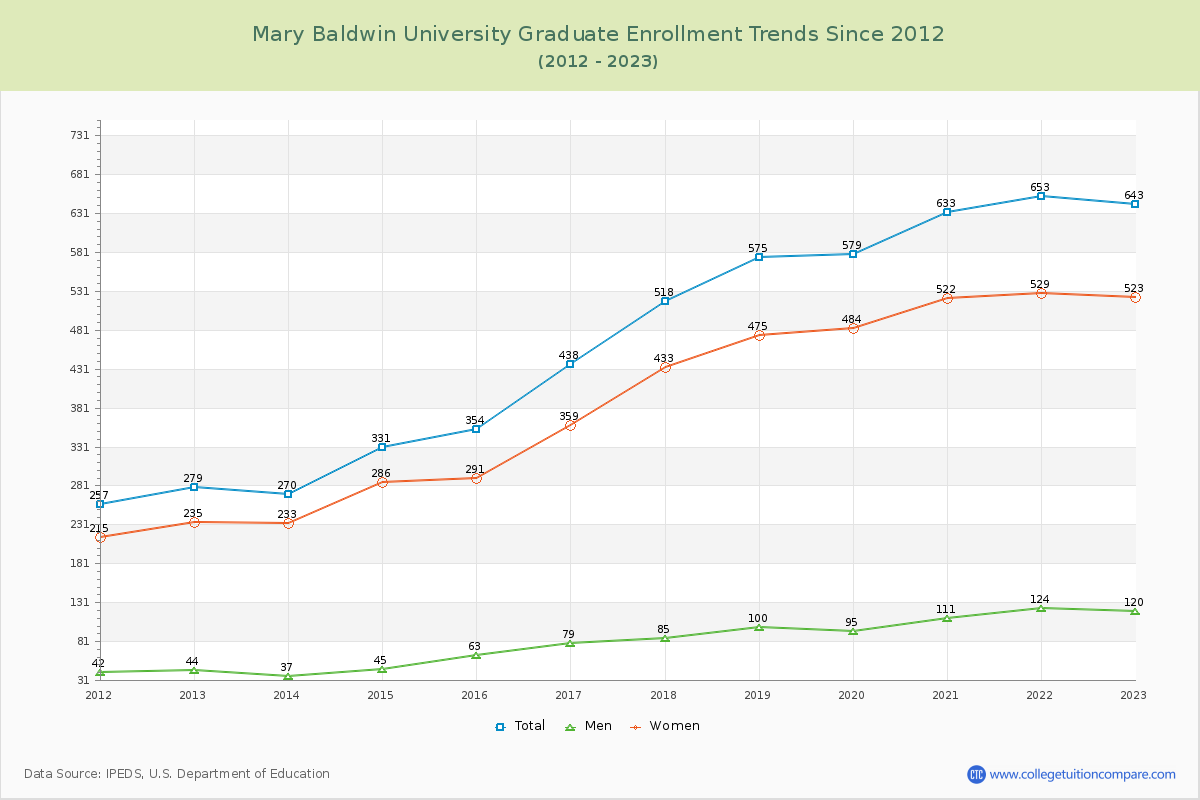
67.14% of total students is undergraduate students and 32.86% students is graduate students. The number of undergraduate students has decreased by 198 and the graduate enrollment has increased by 364 over past 10 years.
The female to male ratio is 3.75 to 1 and it means that there are far more female students enrolled in MBU than male students.
The following table and chart illustrate the changes in student population by gender at Mary Baldwin University since 2012.
| Year | Total | Undergraduate | Graduate | ||||
|---|---|---|---|---|---|---|---|
| Total | Men | Women | Total | Men | Women | ||
| 2012-13 | 1,791 | 1,512 | 89 | 1,423 | 279 | 44 | 235 |
| 2013-14 | 1,711 -80 | 1,441 -71 | 92 3 | 1,349 -74 | 270 -9 | 37 -7 | 233 -2 |
| 2014-15 | 1,757 46 | 1,426 -15 | 102 10 | 1,324 -25 | 331 61 | 45 8 | 286 53 |
| 2015-16 | 1,666 -91 | 1,312 -114 | 94 -8 | 1,218 -106 | 354 23 | 63 18 | 291 5 |
| 2016-17 | 1,748 82 | 1,310 -2 | 101 7 | 1,209 -9 | 438 84 | 79 16 | 359 68 |
| 2017-18 | 1,654 -94 | 1,136 -174 | 85 -16 | 1,051 -158 | 518 80 | 85 6 | 433 74 |
| 2018-19 | 1,902 248 | 1,327 191 | 183 98 | 1,144 93 | 575 57 | 100 15 | 475 42 |
| 2019-20 | 1,986 84 | 1,407 80 | 272 89 | 1,135 -9 | 579 4 | 95 -5 | 484 9 |
| 2020-21 | 2,110 124 | 1,477 70 | 301 29 | 1,176 41 | 633 54 | 111 16 | 522 38 |
| 2021-22 | 2,142 32 | 1,489 12 | 311 10 | 1,178 2 | 653 20 | 124 13 | 529 7 |
| 2022-23 | 1,957 -185 | 1,314 -175 | 292 -19 | 1,022 -156 | 643 -10 | 120 -4 | 523 -6 |
| Average | 1,857 | 1,377 | 175 | 1,203 | 479 | 82 | 397 |