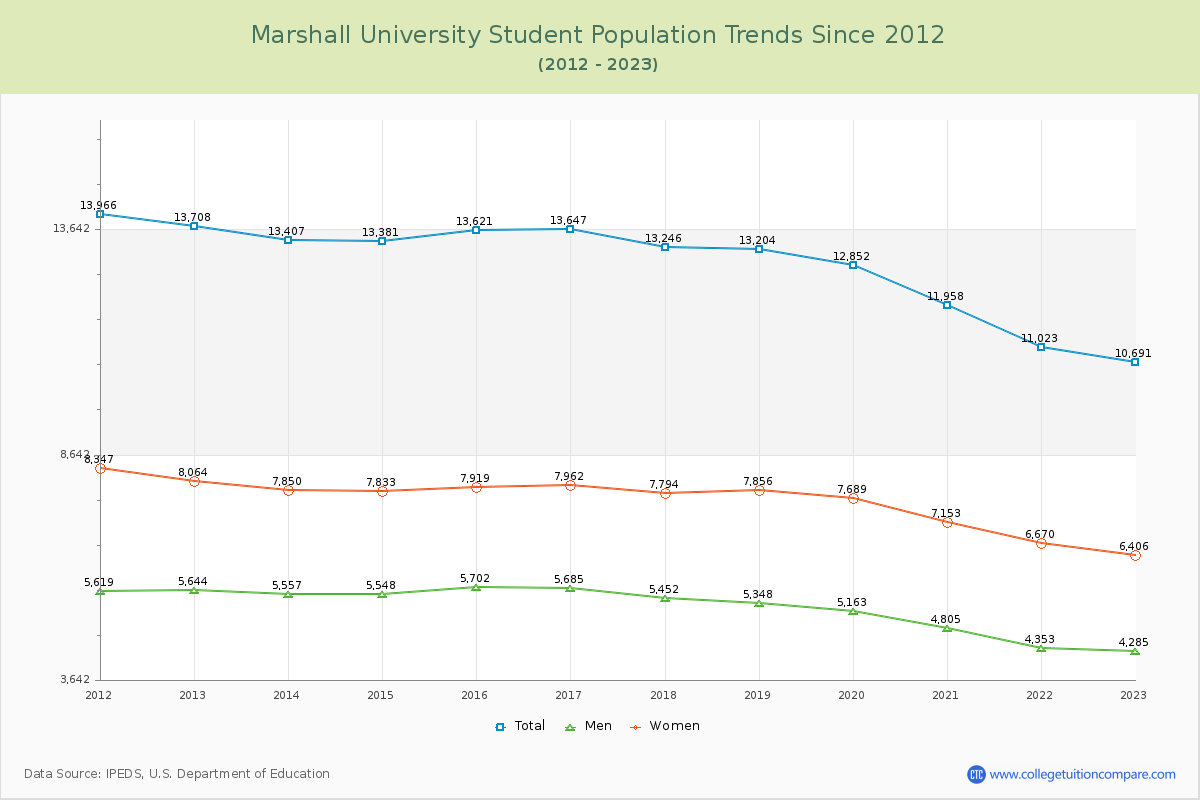
Student Population Changes
The average student population over the last 12 years is 12,794 where 10,691 students are attending the school for the academic year 2022-2023.
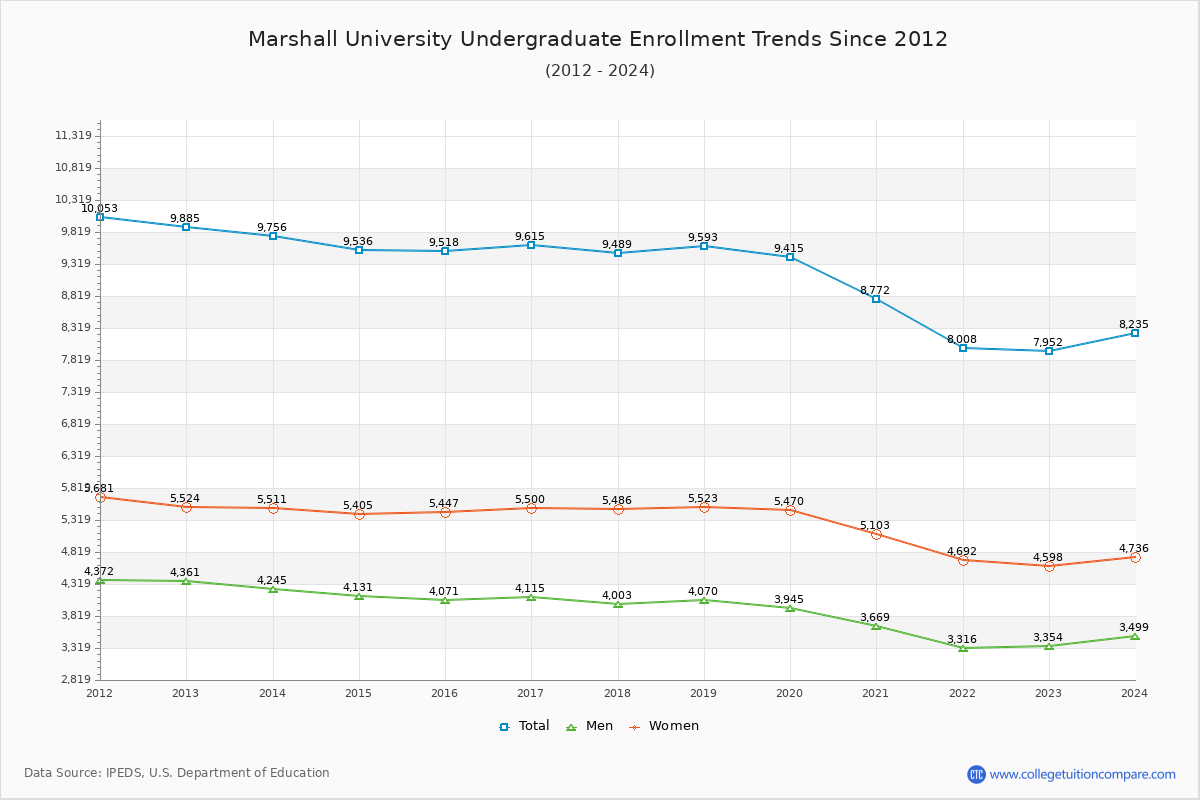
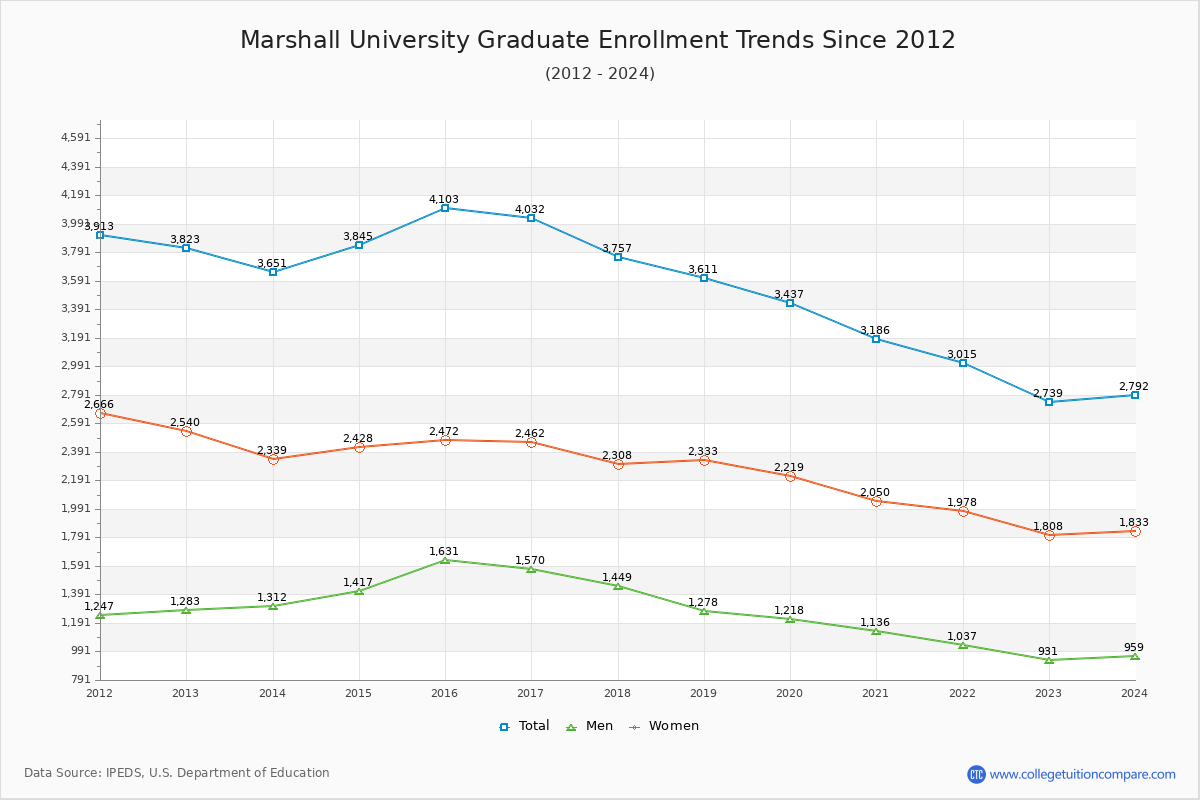
74.38% of total students is undergraduate students and 25.62% students is graduate students. The number of undergraduate students has decreased by 1,933 and the graduate enrollment has decreased by 1,084 over past 10 years.
The female to male ratio is 1.49 to 1 and it means that there are more female students enrolled in Marshall than male students.
The following table and chart illustrate the changes in student population by gender at Marshall University since 2012.
| Year | Total | Undergraduate | Graduate | ||||
|---|---|---|---|---|---|---|---|
| Total | Men | Women | Total | Men | Women | ||
| 2012-13 | 13,708 | 9,885 | 4,361 | 5,524 | 3,823 | 1,283 | 2,540 |
| 2013-14 | 13,407 -301 | 9,756 -129 | 4,245 -116 | 5,511 -13 | 3,651 -172 | 1,312 29 | 2,339 -201 |
| 2014-15 | 13,381 -26 | 9,536 -220 | 4,131 -114 | 5,405 -106 | 3,845 194 | 1,417 105 | 2,428 89 |
| 2015-16 | 13,621 240 | 9,518 -18 | 4,071 -60 | 5,447 42 | 4,103 258 | 1,631 214 | 2,472 44 |
| 2016-17 | 13,647 26 | 9,615 97 | 4,115 44 | 5,500 53 | 4,032 -71 | 1,570 -61 | 2,462 -10 |
| 2017-18 | 13,246 -401 | 9,489 -126 | 4,003 -112 | 5,486 -14 | 3,757 -275 | 1,449 -121 | 2,308 -154 |
| 2018-19 | 13,204 -42 | 9,593 104 | 4,070 67 | 5,523 37 | 3,611 -146 | 1,278 -171 | 2,333 25 |
| 2019-20 | 12,852 -352 | 9,415 -178 | 3,945 -125 | 5,470 -53 | 3,437 -174 | 1,218 -60 | 2,219 -114 |
| 2020-21 | 11,958 -894 | 8,772 -643 | 3,669 -276 | 5,103 -367 | 3,186 -251 | 1,136 -82 | 2,050 -169 |
| 2021-22 | 11,023 -935 | 8,008 -764 | 3,316 -353 | 4,692 -411 | 3,015 -171 | 1,037 -99 | 1,978 -72 |
| 2022-23 | 10,691 -332 | 7,952 -56 | 3,354 38 | 4,598 -94 | 2,739 -276 | 931 -106 | 1,808 -170 |
| Average | 12,794 | 9,231 | 3,935 | 5,296 | 3,564 | 1,297 | 2,267 |