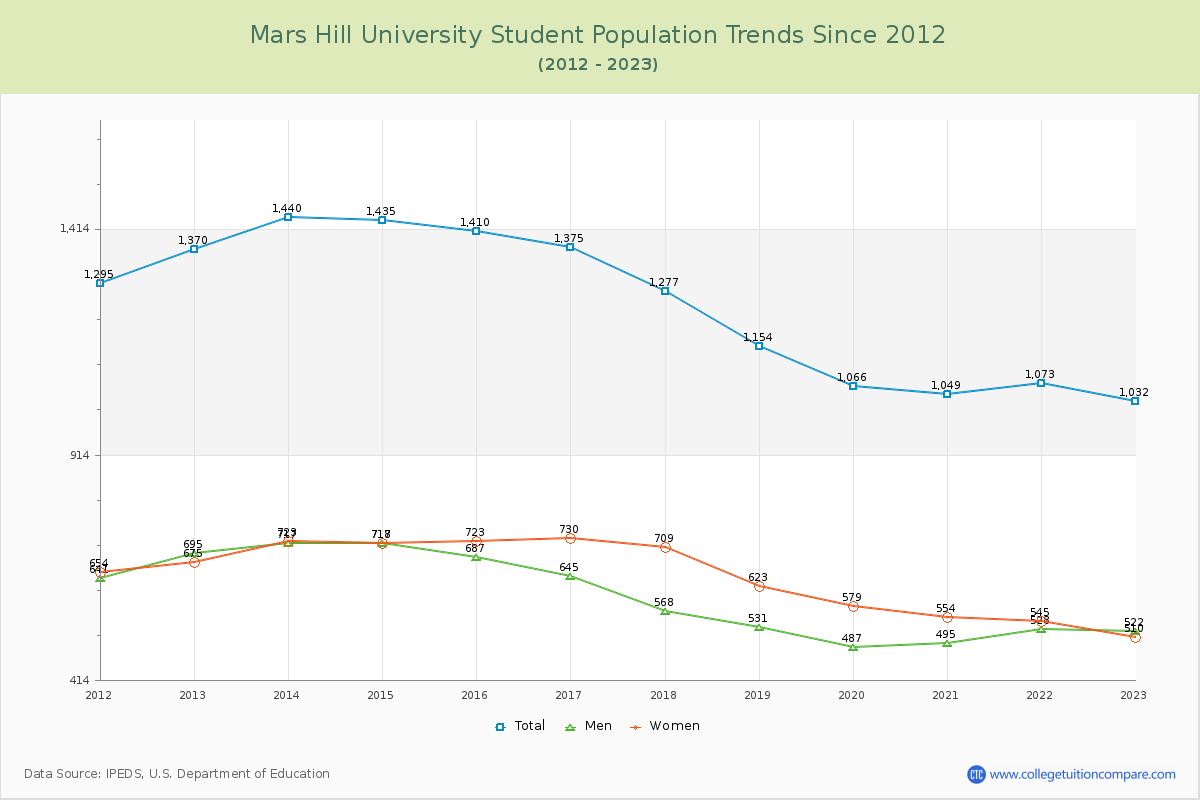
Student Population Changes
The average student population over the last 12 years is 1,244 where 1,032 students are attending the school for the academic year 2022-2023.
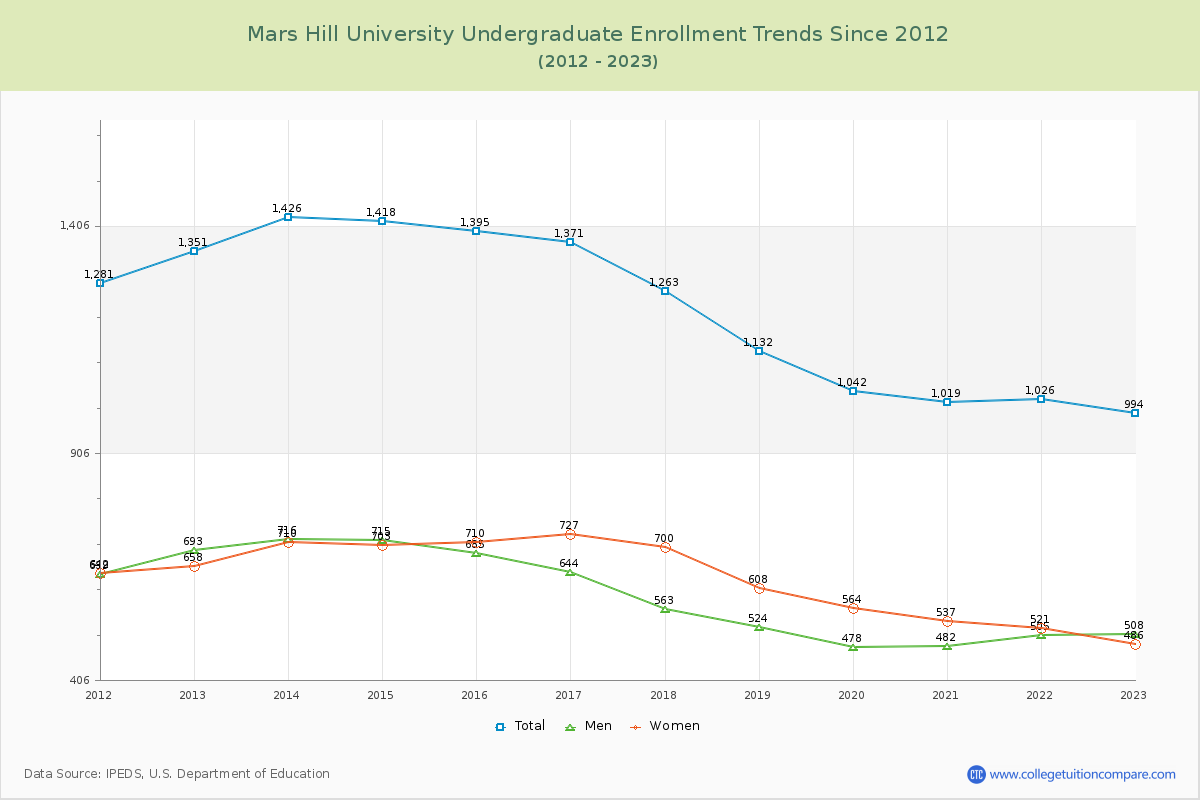
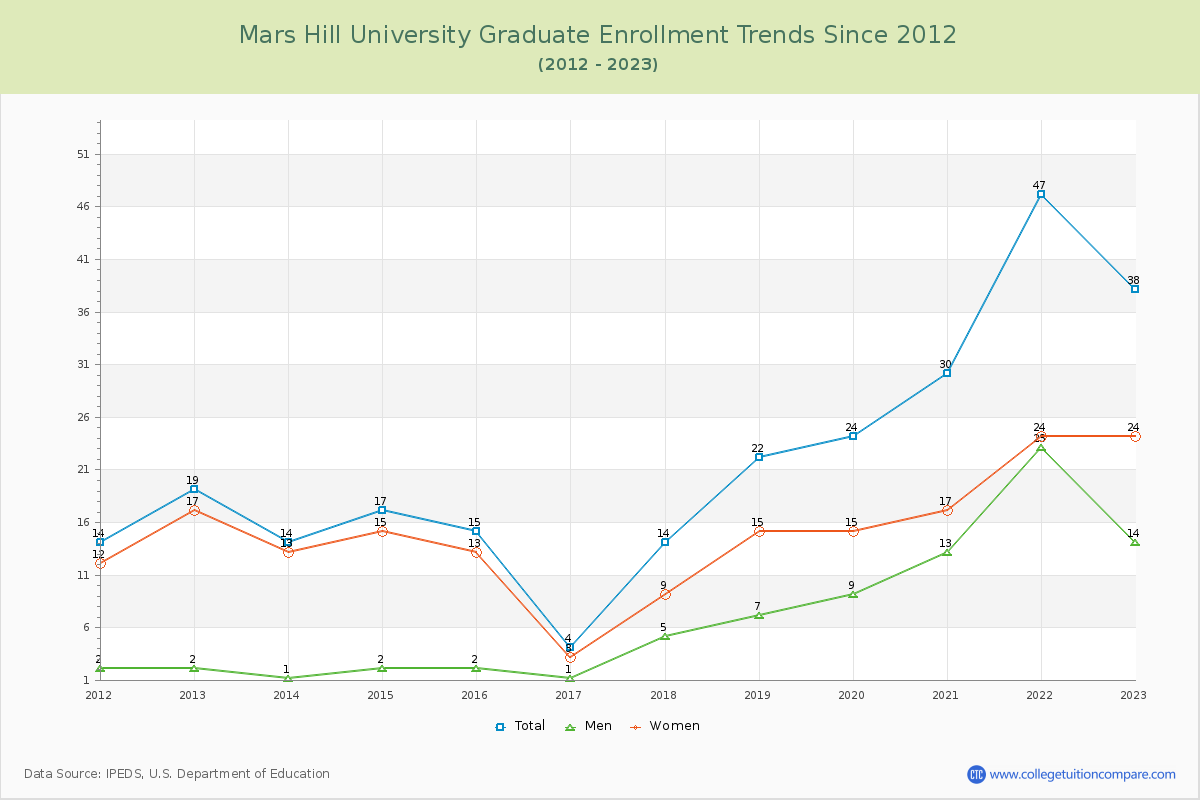
96.32% of total students is undergraduate students and 3.68% students is graduate students. The number of undergraduate students has decreased by 357 and the graduate enrollment has increased by 19 over past 10 years.
The female to male ratio is 0.98 to 1 and it means that there are similar numbers of female and male students enrolled in Mars Hill.
The following table and chart illustrate the changes in student population by gender at Mars Hill University since 2012.
| Year | Total | Undergraduate | Graduate | ||||
|---|---|---|---|---|---|---|---|
| Total | Men | Women | Total | Men | Women | ||
| 2012-13 | 1,370 | 1,351 | 693 | 658 | 19 | 2 | 17 |
| 2013-14 | 1,440 70 | 1,426 75 | 716 23 | 710 52 | 14 -5 | 1 -1 | 13 -4 |
| 2014-15 | 1,435 -5 | 1,418 -8 | 715 -1 | 703 -7 | 17 3 | 2 1 | 15 2 |
| 2015-16 | 1,410 -25 | 1,395 -23 | 685 -30 | 710 7 | 15 -2 | 2 0 | 13 -2 |
| 2016-17 | 1,375 -35 | 1,371 -24 | 644 -41 | 727 17 | 4 -11 | 1 -1 | 3 -10 |
| 2017-18 | 1,277 -98 | 1,263 -108 | 563 -81 | 700 -27 | 14 10 | 5 4 | 9 6 |
| 2018-19 | 1,154 -123 | 1,132 -131 | 524 -39 | 608 -92 | 22 8 | 7 2 | 15 6 |
| 2019-20 | 1,066 -88 | 1,042 -90 | 478 -46 | 564 -44 | 24 2 | 9 2 | 15 0 |
| 2020-21 | 1,049 -17 | 1,019 -23 | 482 4 | 537 -27 | 30 6 | 13 4 | 17 2 |
| 2021-22 | 1,073 24 | 1,026 7 | 505 23 | 521 -16 | 47 17 | 23 10 | 24 7 |
| 2022-23 | 1,032 -41 | 994 -32 | 508 3 | 486 -35 | 38 -9 | 14 -9 | 24 0 |
| Average | 1,244 | 1,222 | 592 | 629 | 22 | 7 | 15 |