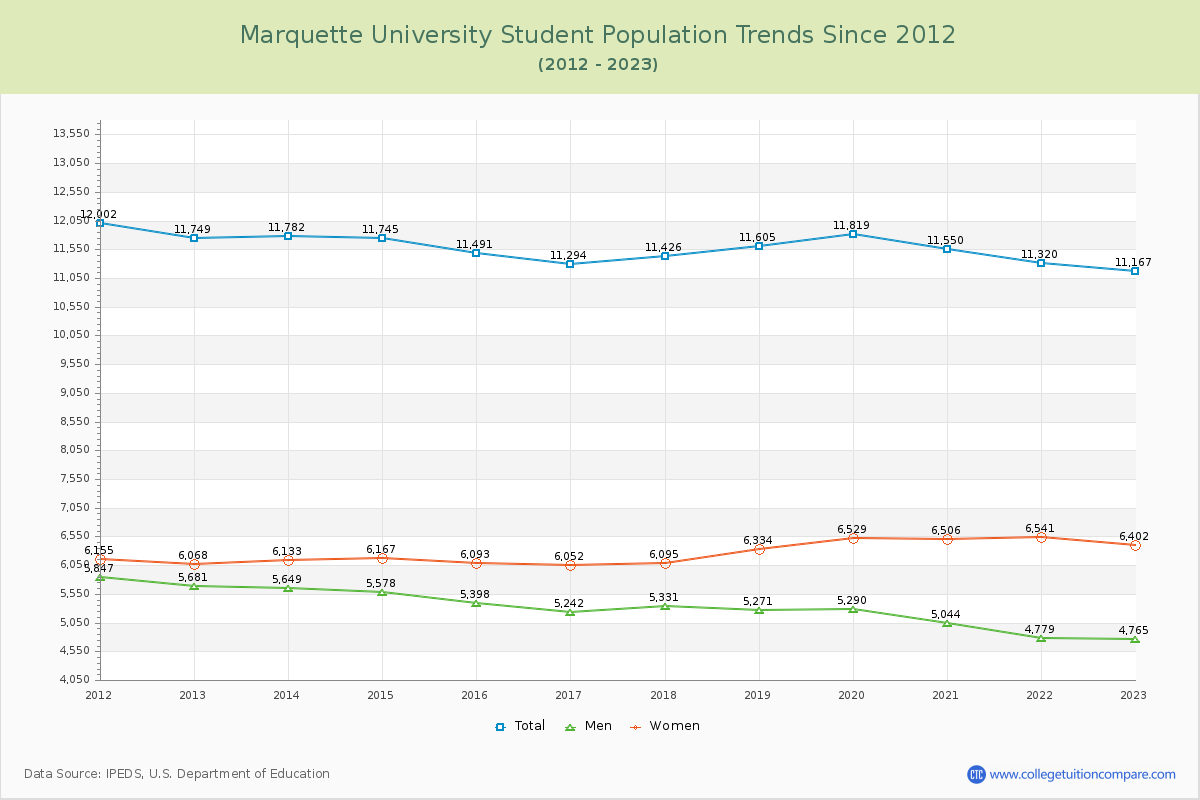
Student Population Changes
The average student population over the last 12 years is 11,541 where 11,167 students are attending the school for the academic year 2022-2023.
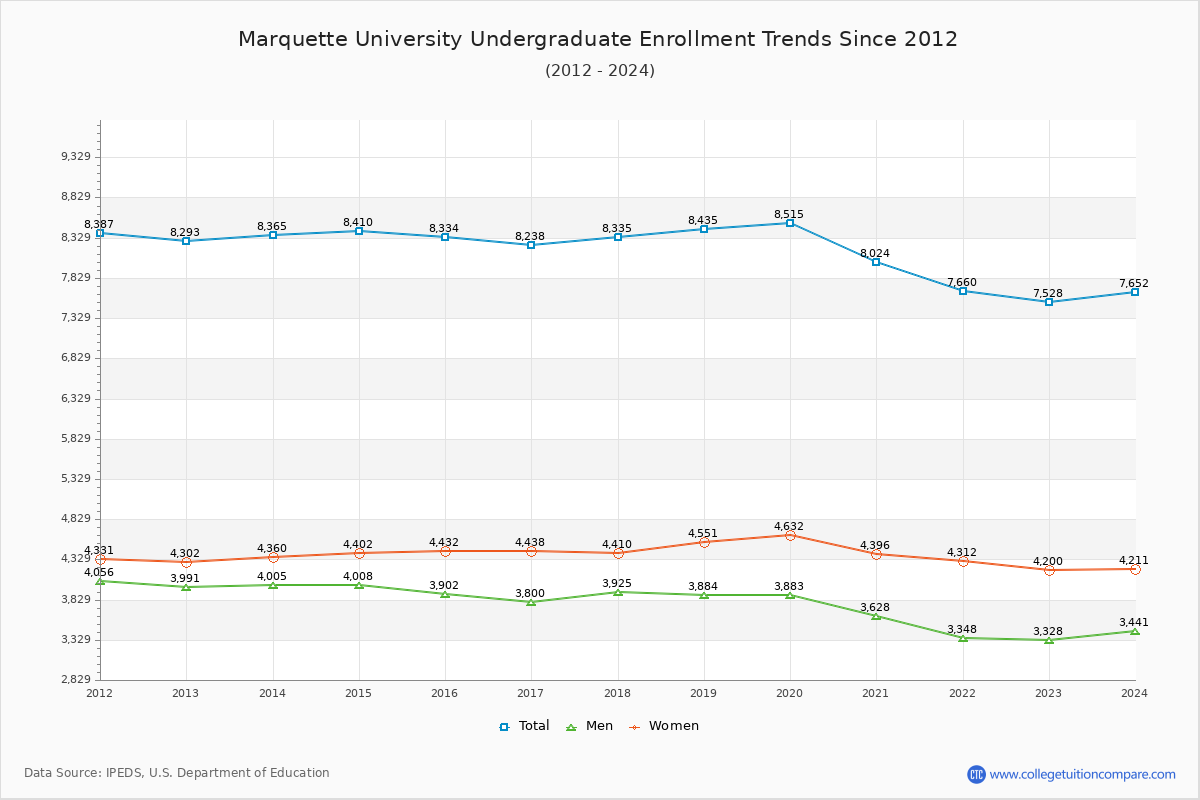
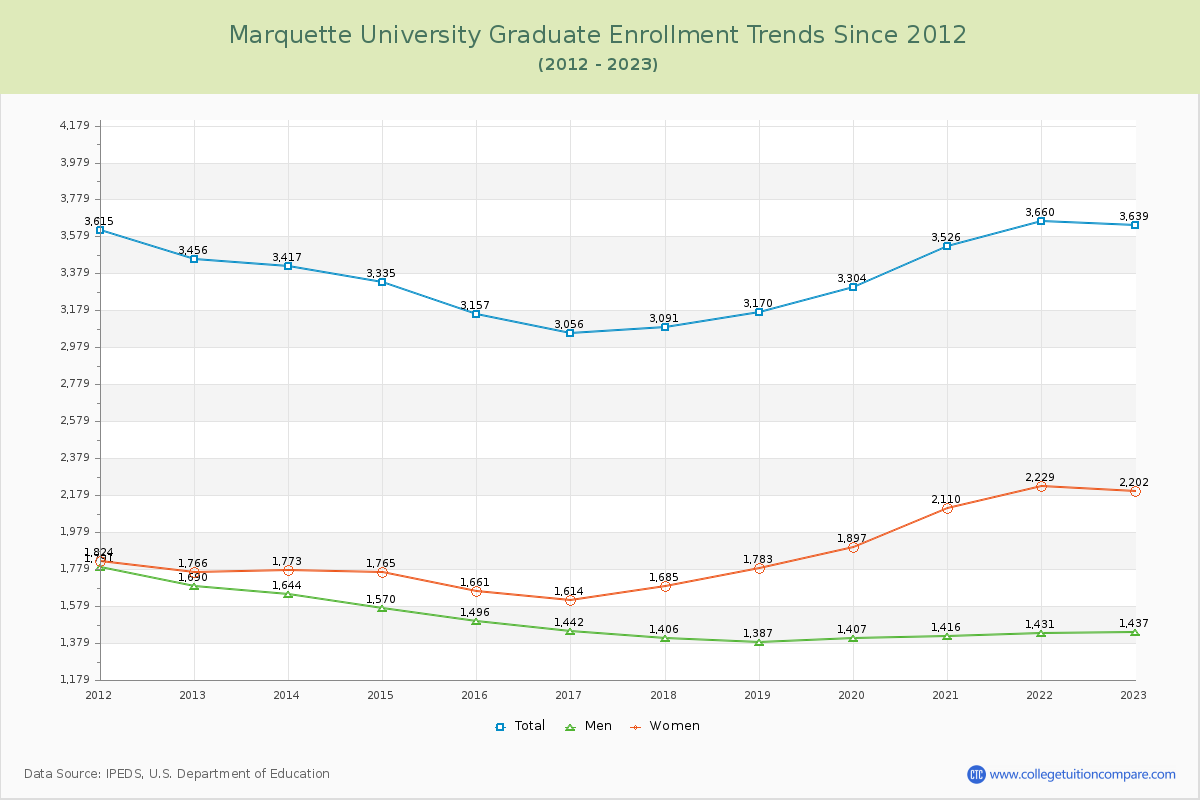
67.41% of total students is undergraduate students and 32.59% students is graduate students. The number of undergraduate students has decreased by 765 and the graduate enrollment has increased by 183 over past 10 years.
The female to male ratio is 1.34 to 1 and it means that there are more female students enrolled in Marquette than male students.
The following table and chart illustrate the changes in student population by gender at Marquette University since 2012.
| Year | Total | Undergraduate | Graduate | ||||
|---|---|---|---|---|---|---|---|
| Total | Men | Women | Total | Men | Women | ||
| 2012-13 | 11,749 | 8,293 | 3,991 | 4,302 | 3,456 | 1,690 | 1,766 |
| 2013-14 | 11,782 33 | 8,365 72 | 4,005 14 | 4,360 58 | 3,417 -39 | 1,644 -46 | 1,773 7 |
| 2014-15 | 11,745 -37 | 8,410 45 | 4,008 3 | 4,402 42 | 3,335 -82 | 1,570 -74 | 1,765 -8 |
| 2015-16 | 11,491 -254 | 8,334 -76 | 3,902 -106 | 4,432 30 | 3,157 -178 | 1,496 -74 | 1,661 -104 |
| 2016-17 | 11,294 -197 | 8,238 -96 | 3,800 -102 | 4,438 6 | 3,056 -101 | 1,442 -54 | 1,614 -47 |
| 2017-18 | 11,426 132 | 8,335 97 | 3,925 125 | 4,410 -28 | 3,091 35 | 1,406 -36 | 1,685 71 |
| 2018-19 | 11,605 179 | 8,435 100 | 3,884 -41 | 4,551 141 | 3,170 79 | 1,387 -19 | 1,783 98 |
| 2019-20 | 11,819 214 | 8,515 80 | 3,883 -1 | 4,632 81 | 3,304 134 | 1,407 20 | 1,897 114 |
| 2020-21 | 11,550 -269 | 8,024 -491 | 3,628 -255 | 4,396 -236 | 3,526 222 | 1,416 9 | 2,110 213 |
| 2021-22 | 11,320 -230 | 7,660 -364 | 3,348 -280 | 4,312 -84 | 3,660 134 | 1,431 15 | 2,229 119 |
| 2022-23 | 11,167 -153 | 7,528 -132 | 3,328 -20 | 4,200 -112 | 3,639 -21 | 1,437 6 | 2,202 -27 |
| Average | 11,541 | 8,194 | 3,791 | 4,403 | 3,346 | 1,484 | 1,862 |