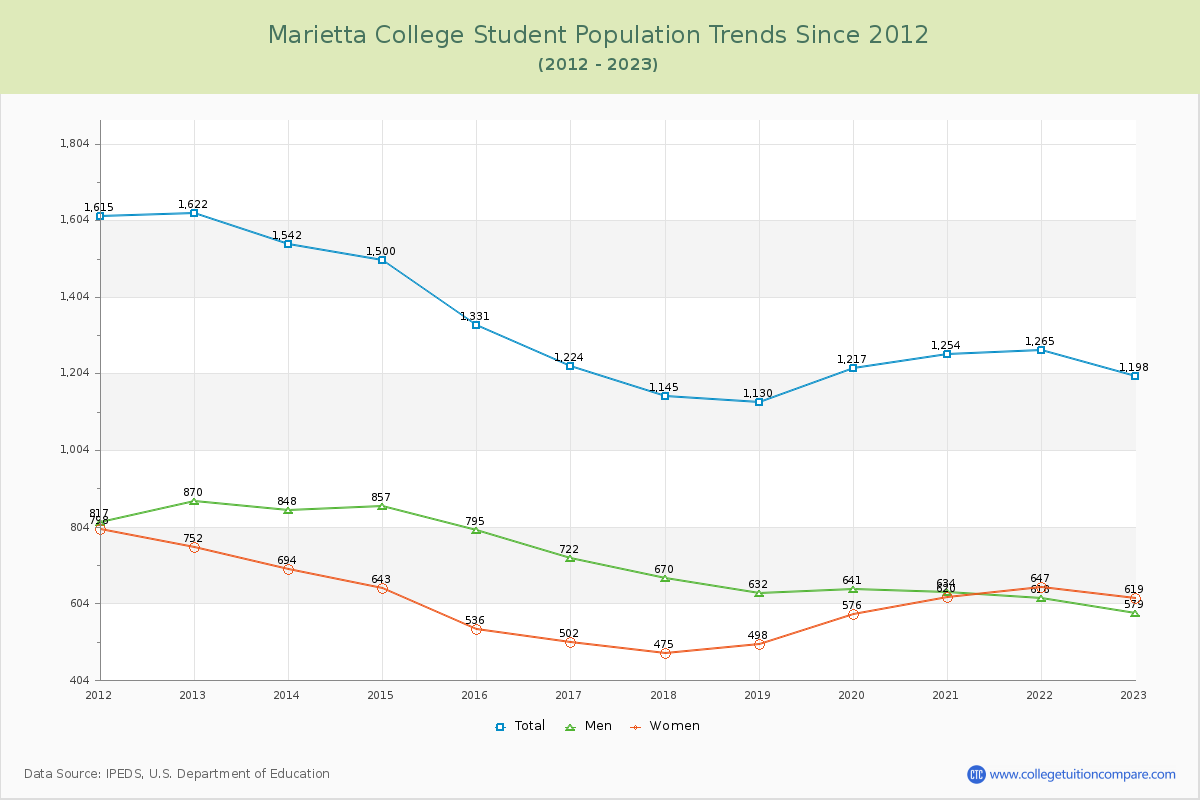
Student Population Changes
The average student population over the last 12 years is 1,312 where 1,198 students are attending the school for the academic year 2022-2023.
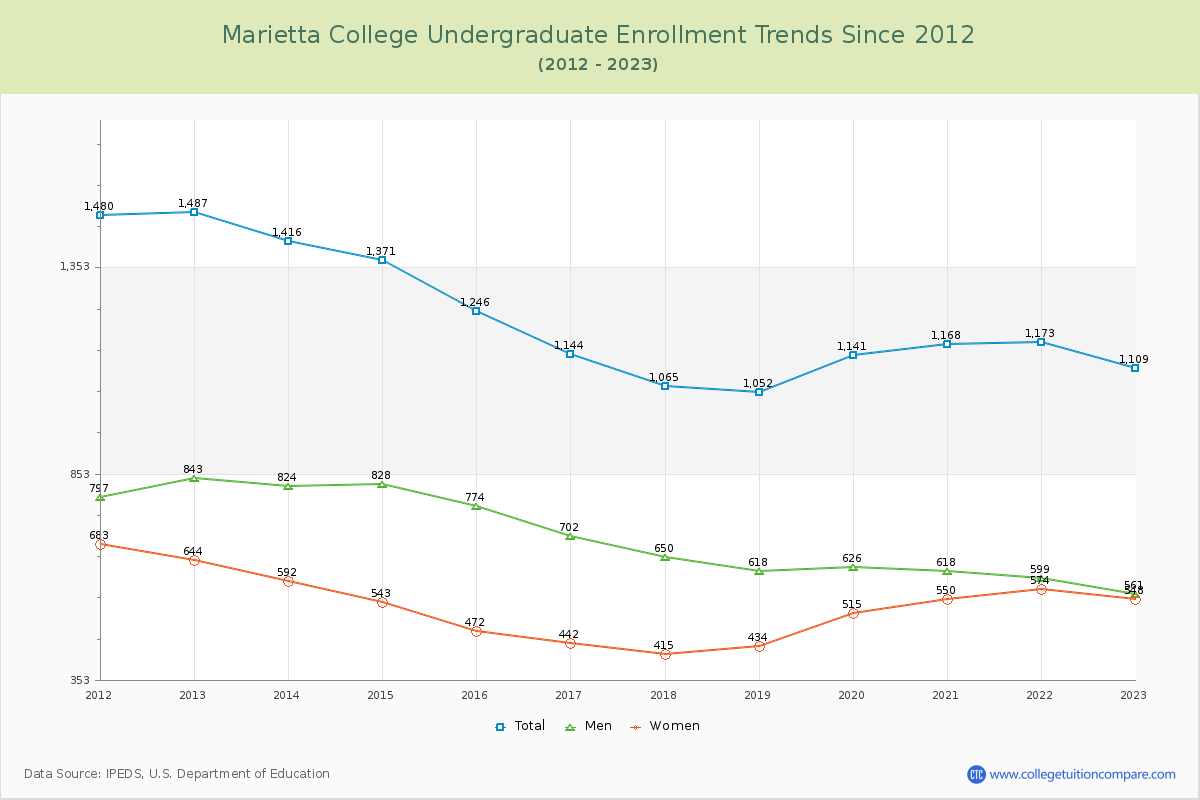
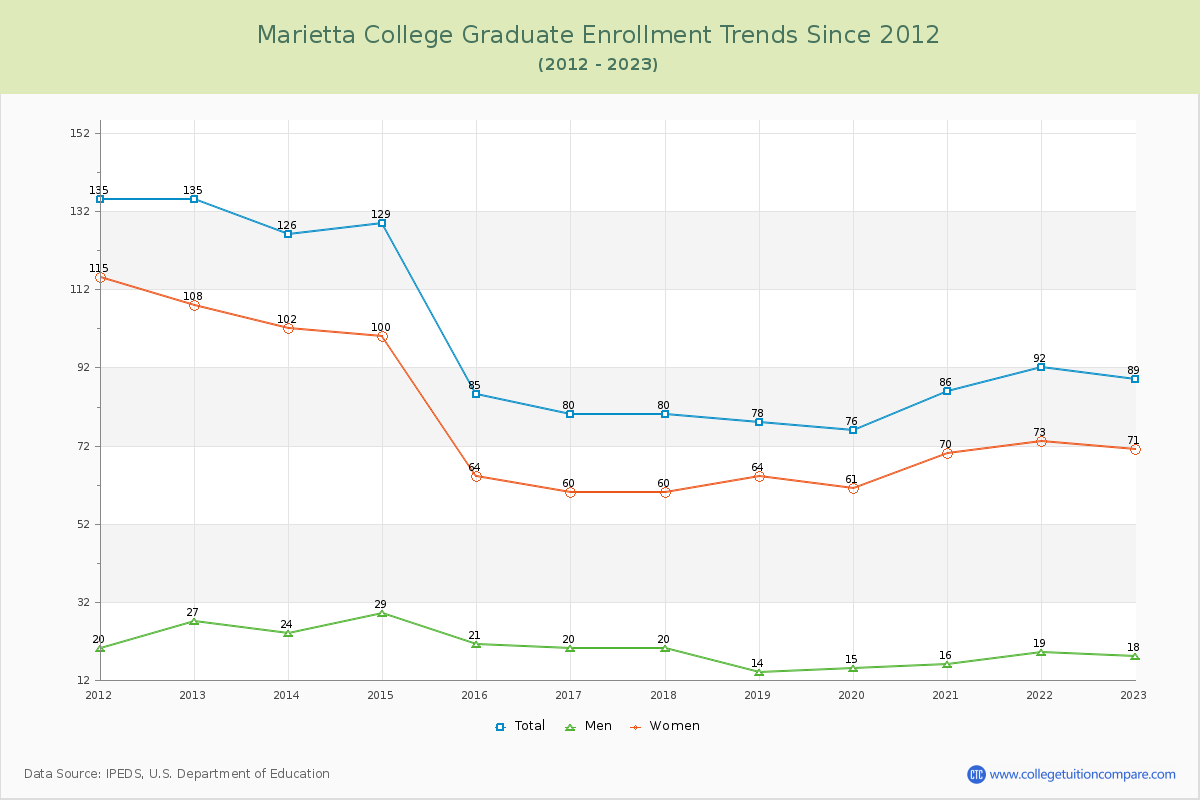
92.57% of total students is undergraduate students and 7.43% students is graduate students. The number of undergraduate students has decreased by 378 and the graduate enrollment has decreased by 46 over past 10 years.
The female to male ratio is 1.07 to 1 and it means that there are similar numbers of female and male students enrolled in Marietta.
The following table and chart illustrate the changes in student population by gender at Marietta College since 2012.
| Year | Total | Undergraduate | Graduate | ||||
|---|---|---|---|---|---|---|---|
| Total | Men | Women | Total | Men | Women | ||
| 2012-13 | 1,622 | 1,487 | 843 | 644 | 135 | 27 | 108 |
| 2013-14 | 1,542 -80 | 1,416 -71 | 824 -19 | 592 -52 | 126 -9 | 24 -3 | 102 -6 |
| 2014-15 | 1,500 -42 | 1,371 -45 | 828 4 | 543 -49 | 129 3 | 29 5 | 100 -2 |
| 2015-16 | 1,331 -169 | 1,246 -125 | 774 -54 | 472 -71 | 85 -44 | 21 -8 | 64 -36 |
| 2016-17 | 1,224 -107 | 1,144 -102 | 702 -72 | 442 -30 | 80 -5 | 20 -1 | 60 -4 |
| 2017-18 | 1,145 -79 | 1,065 -79 | 650 -52 | 415 -27 | 80 0 | 20 0 | 60 0 |
| 2018-19 | 1,130 -15 | 1,052 -13 | 618 -32 | 434 19 | 78 -2 | 14 -6 | 64 4 |
| 2019-20 | 1,217 87 | 1,141 89 | 626 8 | 515 81 | 76 -2 | 15 1 | 61 -3 |
| 2020-21 | 1,254 37 | 1,168 27 | 618 -8 | 550 35 | 86 10 | 16 1 | 70 9 |
| 2021-22 | 1,265 11 | 1,173 5 | 599 -19 | 574 24 | 92 6 | 19 3 | 73 3 |
| 2022-23 | 1,198 -67 | 1,109 -64 | 561 -38 | 548 -26 | 89 -3 | 18 -1 | 71 -2 |
| Average | 1,312 | 1,216 | 695 | 521 | 96 | 20 | 76 |