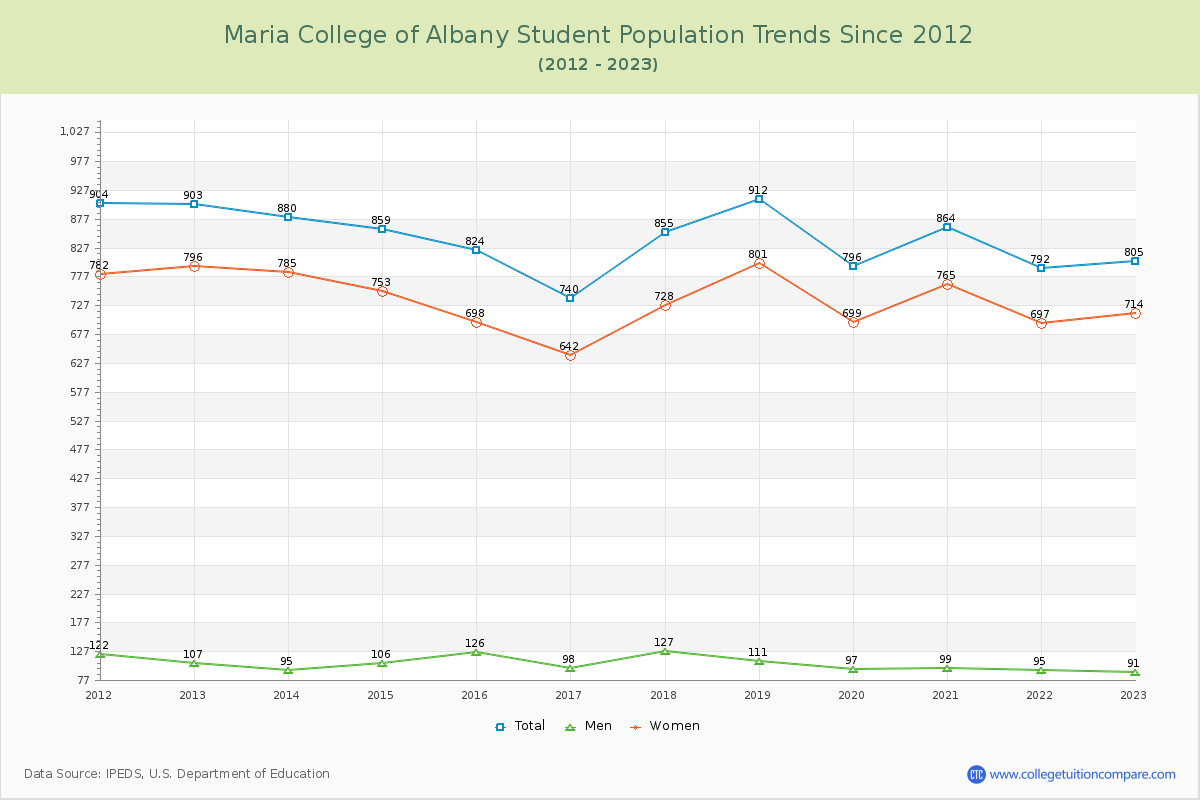
Student Population Changes
The average student population over the last 12 years is 839 where 805 students are attending the school for the academic year 2022-2023.
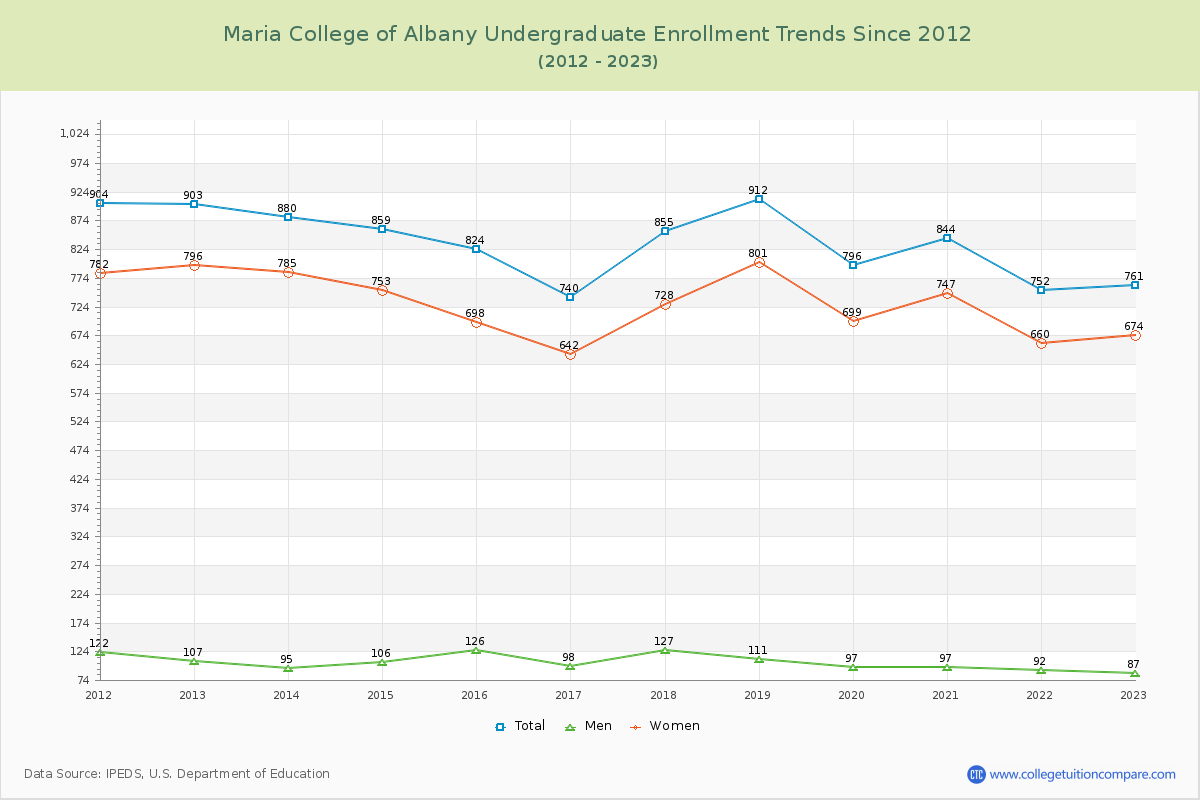
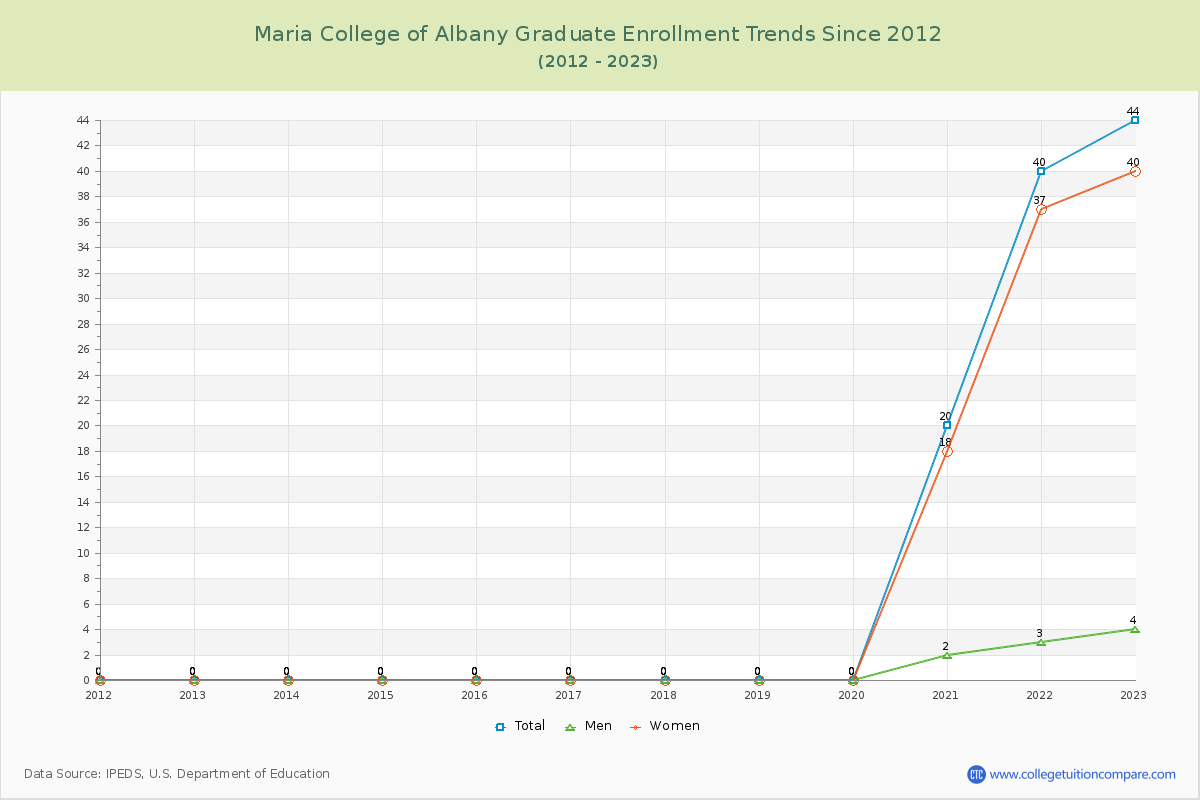
94.53% of total students is undergraduate students and 5.47% students is graduate students. The number of undergraduate students has decreased by 142 and the graduate enrollment has increased by 44 over past 10 years.
The female to male ratio is 7.85 to 1 and it means that there are far more female students enrolled in Maria College of Albany than male students.
The following table and chart illustrate the changes in student population by gender at Maria College of Albany since 2012.
| Year | Total | Undergraduate | Graduate | ||||
|---|---|---|---|---|---|---|---|
| Total | Men | Women | Total | Men | Women | ||
| 2012-13 | 903 | 903 | 107 | 796 | 0 | 0 | 0 |
| 2013-14 | 880 -23 | 880 -23 | 95 -12 | 785 -11 | 0 0 | 0 0 | 0 0 |
| 2014-15 | 859 -21 | 859 -21 | 106 11 | 753 -32 | 0 0 | 0 0 | 0 0 |
| 2015-16 | 824 -35 | 824 -35 | 126 20 | 698 -55 | 0 0 | 0 0 | 0 0 |
| 2016-17 | 740 -84 | 740 -84 | 98 -28 | 642 -56 | 0 0 | 0 0 | 0 0 |
| 2017-18 | 855 115 | 855 115 | 127 29 | 728 86 | 0 0 | 0 0 | 0 0 |
| 2018-19 | 912 57 | 912 57 | 111 -16 | 801 73 | 0 0 | 0 0 | 0 0 |
| 2019-20 | 796 -116 | 796 -116 | 97 -14 | 699 -102 | 0 0 | 0 0 | 0 0 |
| 2020-21 | 864 68 | 844 48 | 97 0 | 747 48 | 20 20 | 2 2 | 18 18 |
| 2021-22 | 792 -72 | 752 -92 | 92 -5 | 660 -87 | 40 20 | 3 1 | 37 19 |
| 2022-23 | 805 13 | 761 9 | 87 -5 | 674 14 | 44 4 | 4 1 | 40 3 |
| Average | 839 | 830 | 104 | 726 | 9 | 1 | 9 |