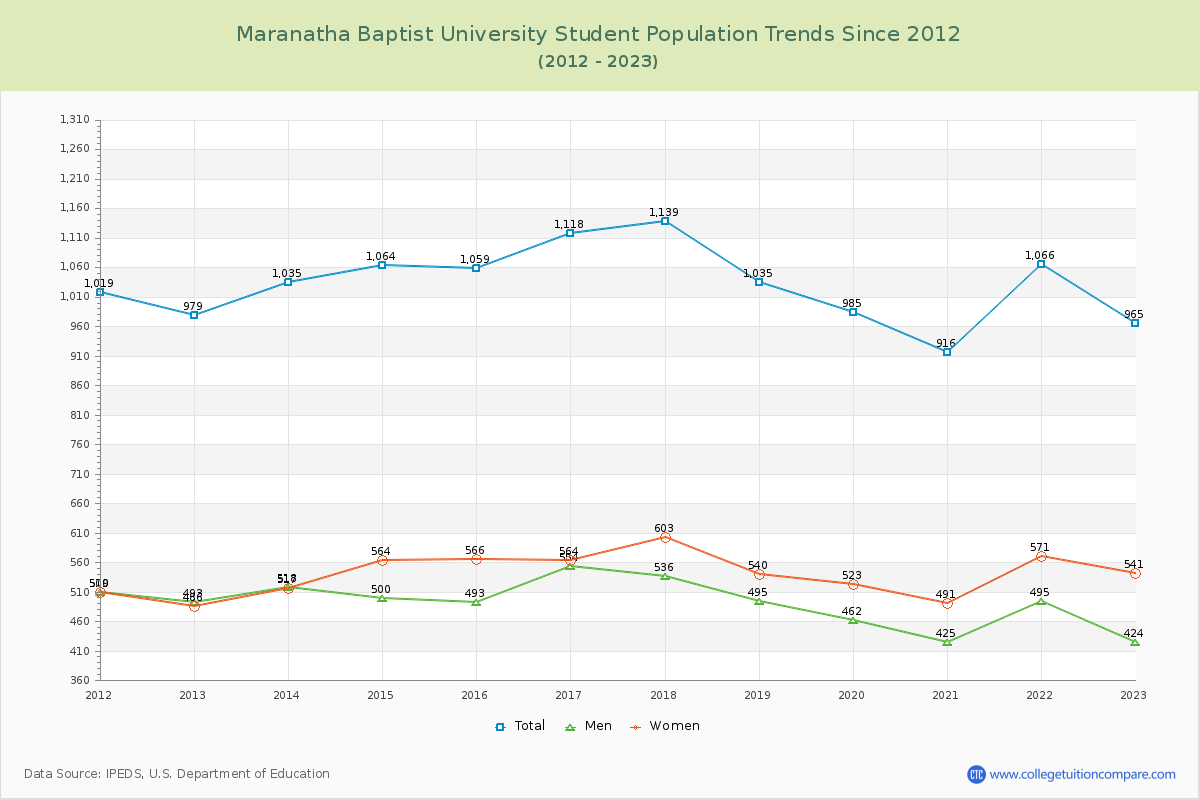
Student Population Changes
The average student population over the last 12 years is 1,033 where 965 students are attending the school for the academic year 2022-2023.
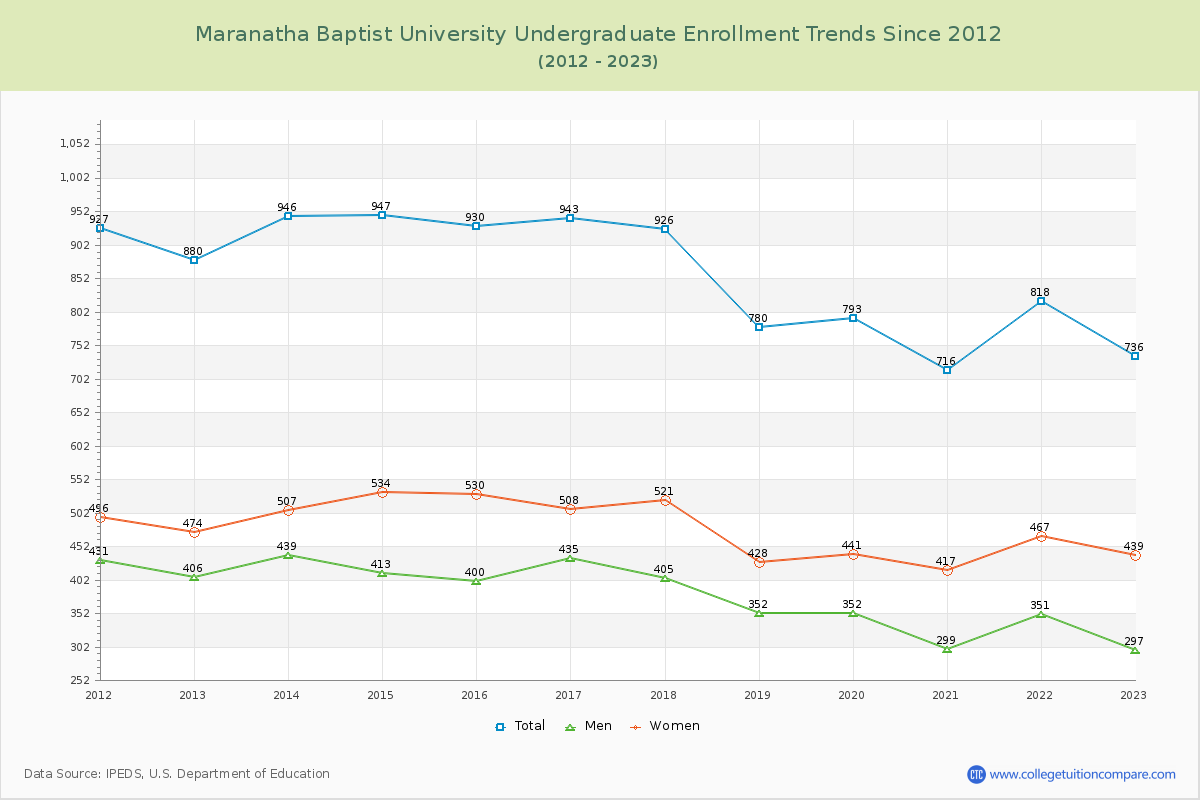
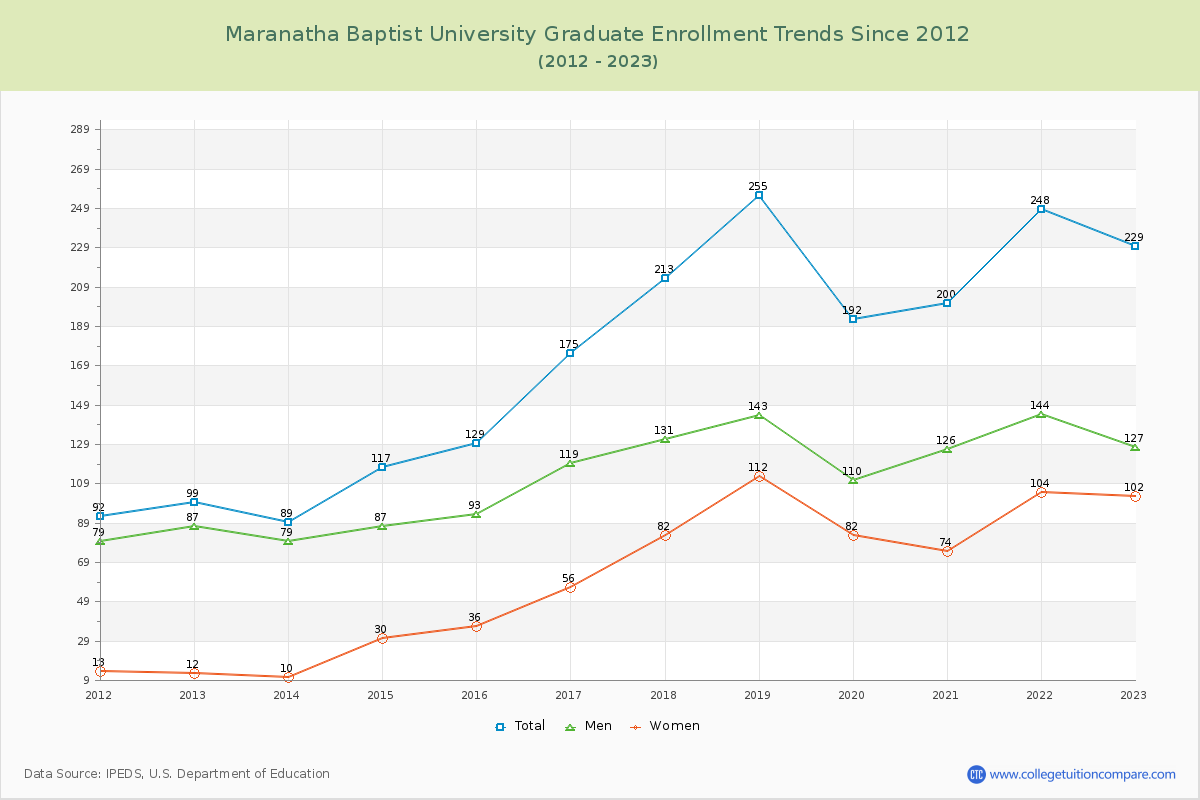
76.27% of total students is undergraduate students and 23.73% students is graduate students. The number of undergraduate students has decreased by 144 and the graduate enrollment has increased by 130 over past 10 years.
The female to male ratio is 1.28 to 1 and it means that there are slightly more female students enrolled in MBBC than male students.
The following table and chart illustrate the changes in student population by gender at Maranatha Baptist University since 2012.
| Year | Total | Undergraduate | Graduate | ||||
|---|---|---|---|---|---|---|---|
| Total | Men | Women | Total | Men | Women | ||
| 2012-13 | 979 | 880 | 406 | 474 | 99 | 87 | 12 |
| 2013-14 | 1,035 56 | 946 66 | 439 33 | 507 33 | 89 -10 | 79 -8 | 10 -2 |
| 2014-15 | 1,064 29 | 947 1 | 413 -26 | 534 27 | 117 28 | 87 8 | 30 20 |
| 2015-16 | 1,059 -5 | 930 -17 | 400 -13 | 530 -4 | 129 12 | 93 6 | 36 6 |
| 2016-17 | 1,118 59 | 943 13 | 435 35 | 508 -22 | 175 46 | 119 26 | 56 20 |
| 2017-18 | 1,139 21 | 926 -17 | 405 -30 | 521 13 | 213 38 | 131 12 | 82 26 |
| 2018-19 | 1,035 -104 | 780 -146 | 352 -53 | 428 -93 | 255 42 | 143 12 | 112 30 |
| 2019-20 | 985 -50 | 793 13 | 352 0 | 441 13 | 192 -63 | 110 -33 | 82 -30 |
| 2020-21 | 916 -69 | 716 -77 | 299 -53 | 417 -24 | 200 8 | 126 16 | 74 -8 |
| 2021-22 | 1,066 150 | 818 102 | 351 52 | 467 50 | 248 48 | 144 18 | 104 30 |
| 2022-23 | 965 -101 | 736 -82 | 297 -54 | 439 -28 | 229 -19 | 127 -17 | 102 -2 |
| Average | 1,033 | 856 | 377 | 479 | 177 | 113 | 64 |