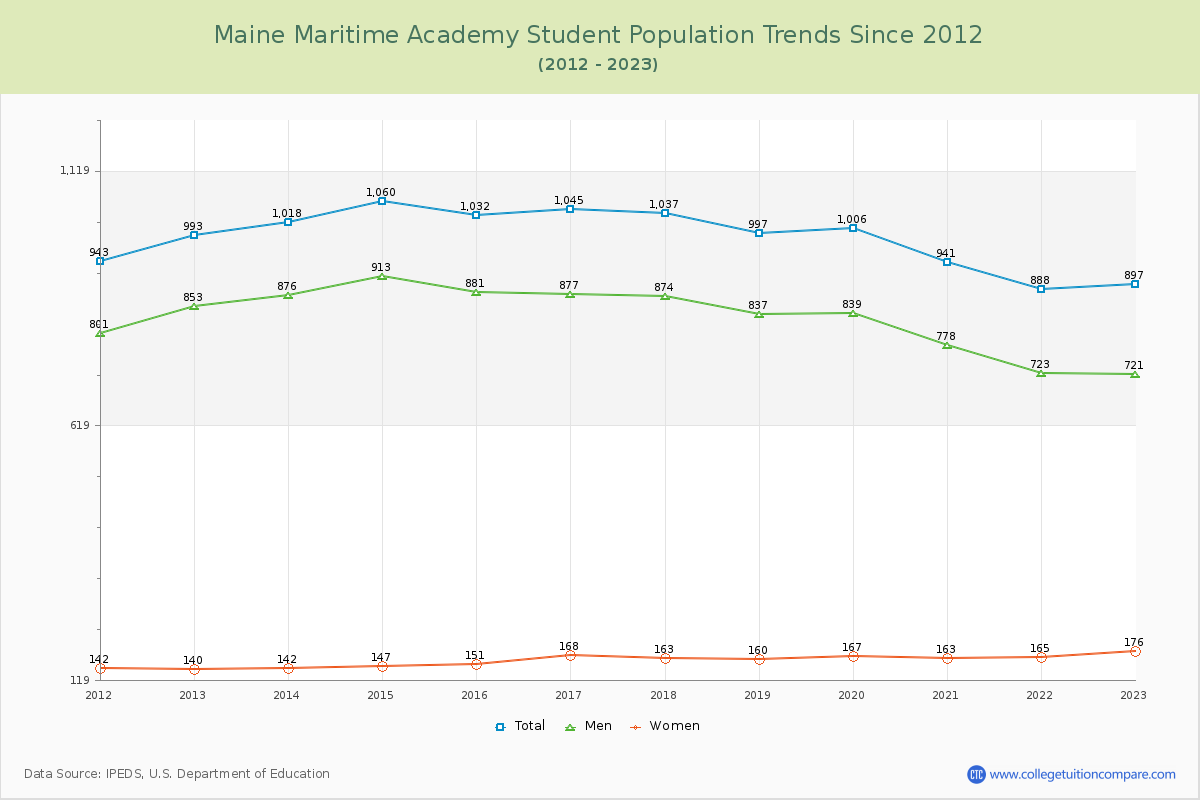
Student Population Changes
The average student population over the last 12 years is 992 where 897 students are attending the school for the academic year 2022-2023.
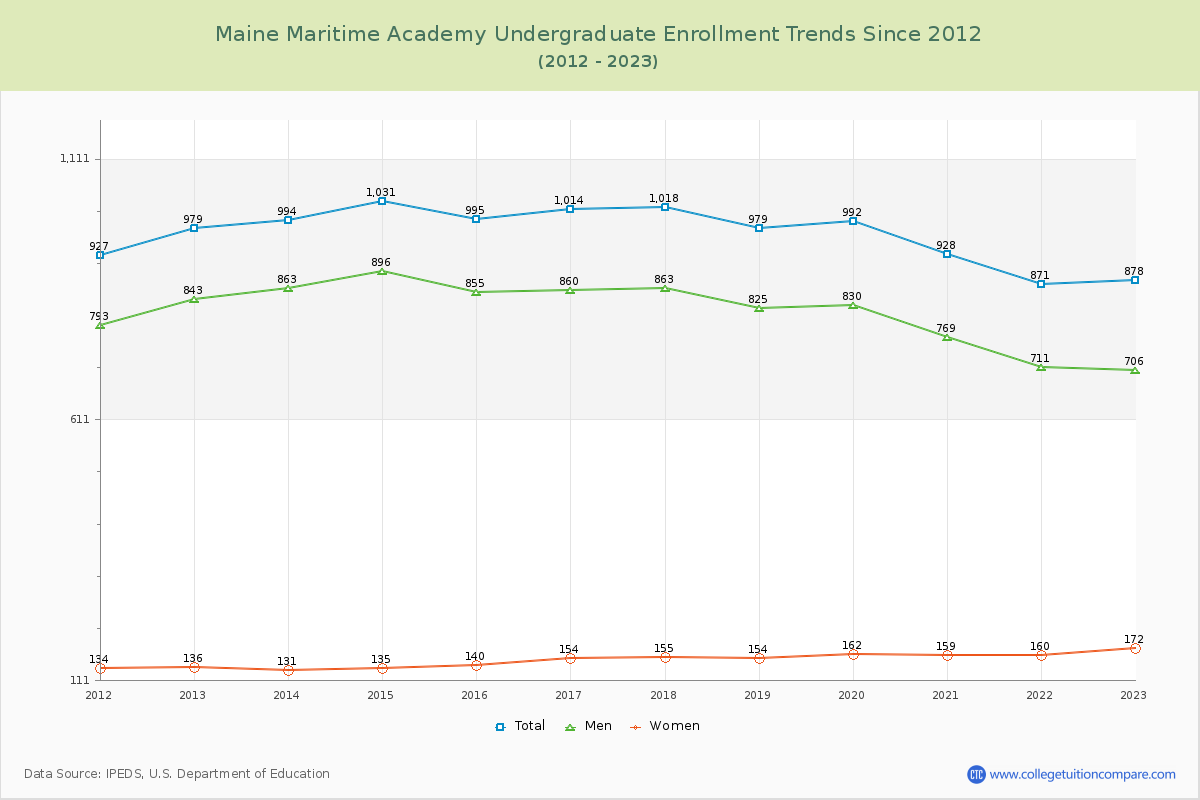
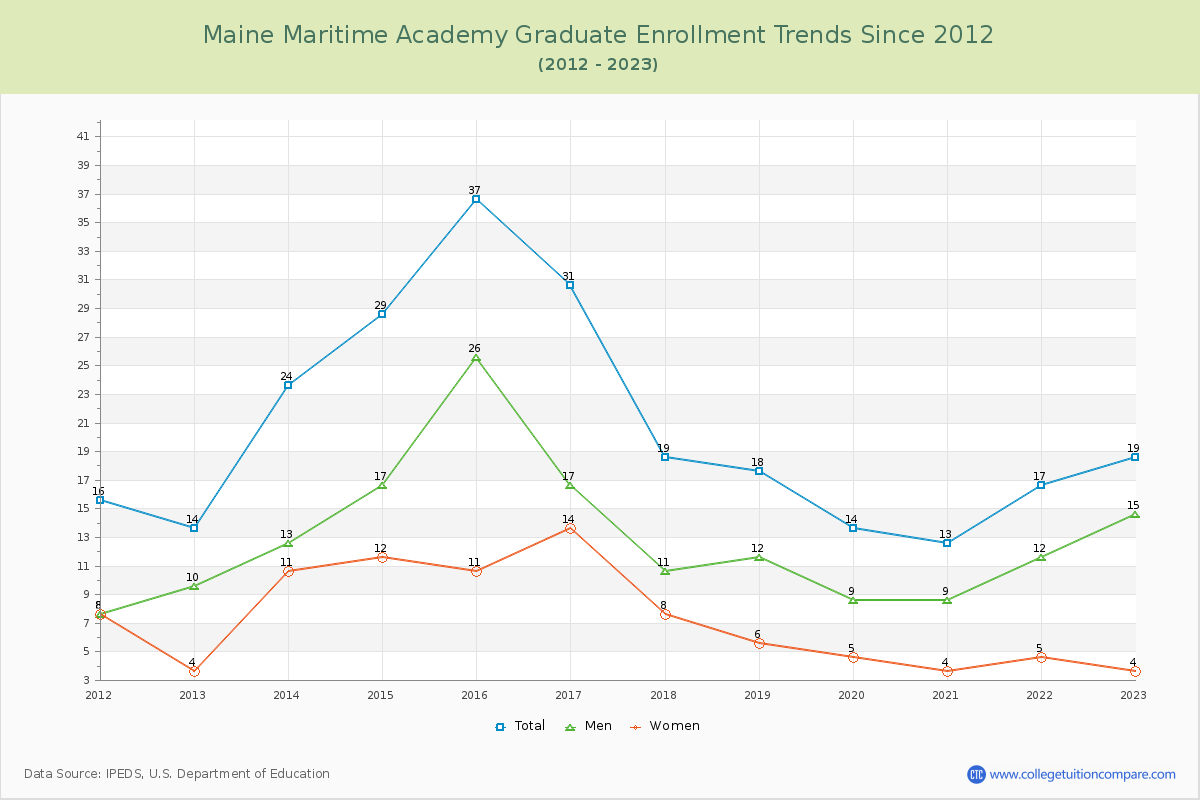
97.88% of total students is undergraduate students and 2.12% students is graduate students. The number of undergraduate students has decreased by 101 and the graduate enrollment has increased by 5 over past 10 years.
The female to male ratio is 0.24 to 1 and it means that there are far more male students enrolled in Maine Maritime Academy than female students.
The following table and chart illustrate the changes in student population by gender at Maine Maritime Academy since 2012.
| Year | Total | Undergraduate | Graduate | ||||
|---|---|---|---|---|---|---|---|
| Total | Men | Women | Total | Men | Women | ||
| 2012-13 | 993 | 979 | 843 | 136 | 14 | 10 | 4 |
| 2013-14 | 1,018 25 | 994 15 | 863 20 | 131 -5 | 24 10 | 13 3 | 11 7 |
| 2014-15 | 1,060 42 | 1,031 37 | 896 33 | 135 4 | 29 5 | 17 4 | 12 1 |
| 2015-16 | 1,032 -28 | 995 -36 | 855 -41 | 140 5 | 37 8 | 26 9 | 11 -1 |
| 2016-17 | 1,045 13 | 1,014 19 | 860 5 | 154 14 | 31 -6 | 17 -9 | 14 3 |
| 2017-18 | 1,037 -8 | 1,018 4 | 863 3 | 155 1 | 19 -12 | 11 -6 | 8 -6 |
| 2018-19 | 997 -40 | 979 -39 | 825 -38 | 154 -1 | 18 -1 | 12 1 | 6 -2 |
| 2019-20 | 1,006 9 | 992 13 | 830 5 | 162 8 | 14 -4 | 9 -3 | 5 -1 |
| 2020-21 | 941 -65 | 928 -64 | 769 -61 | 159 -3 | 13 -1 | 9 0 | 4 -1 |
| 2021-22 | 888 -53 | 871 -57 | 711 -58 | 160 1 | 17 4 | 12 3 | 5 1 |
| 2022-23 | 897 9 | 878 7 | 706 -5 | 172 12 | 19 2 | 15 3 | 4 -1 |
| Average | 992 | 971 | 820 | 151 | 21 | 14 | 8 |