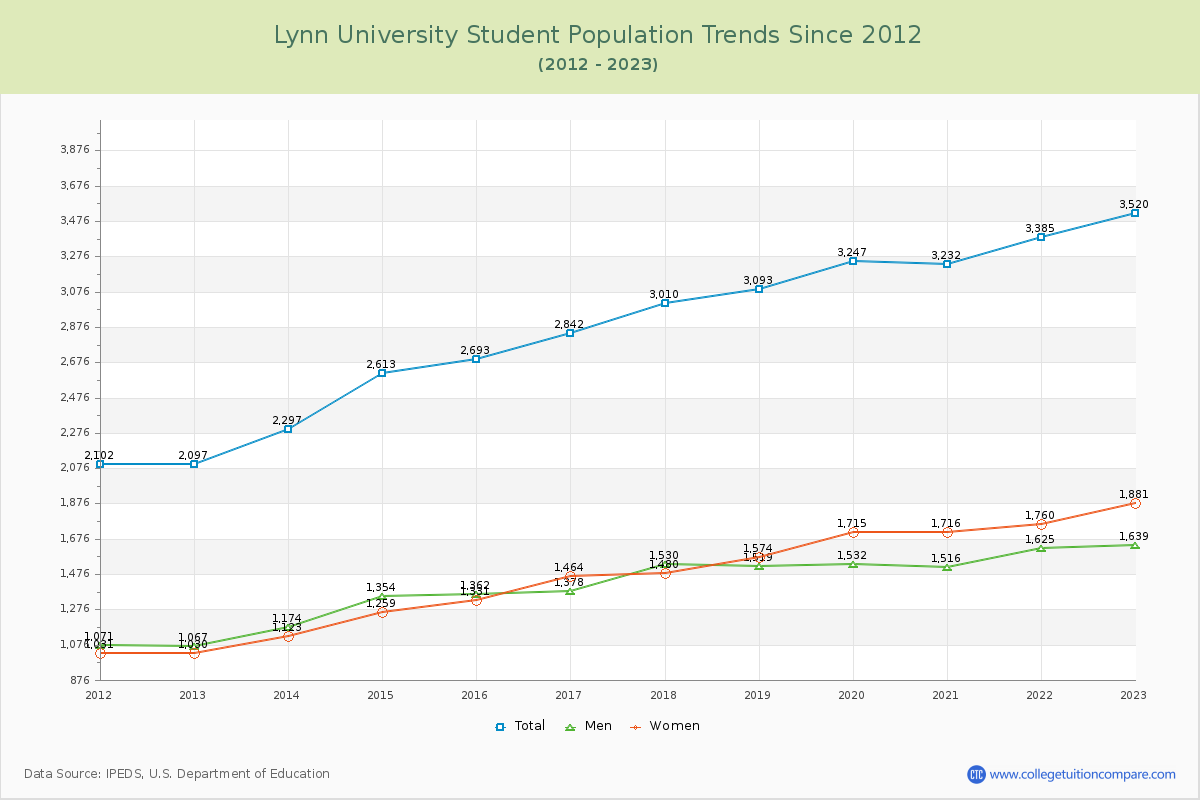
Student Population Changes
The average student population over the last 12 years is 2,912 where 3,520 students are attending the school for the academic year 2022-2023.
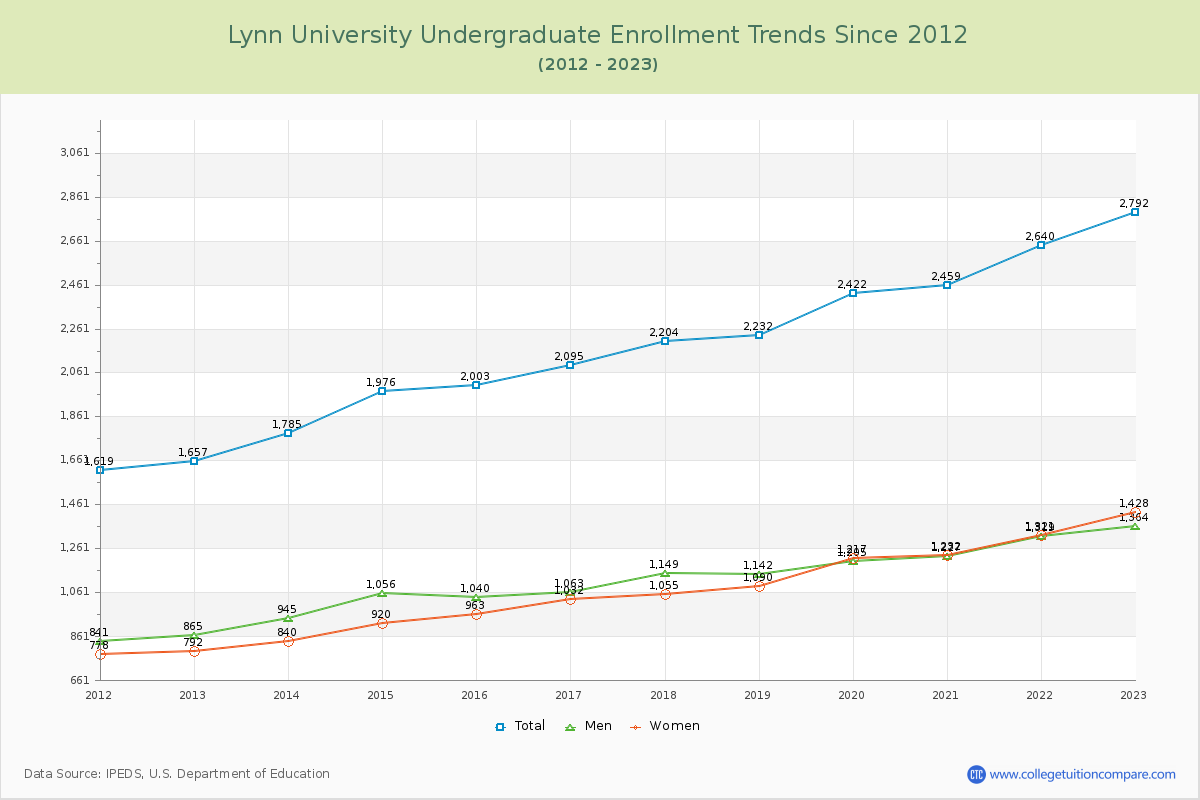
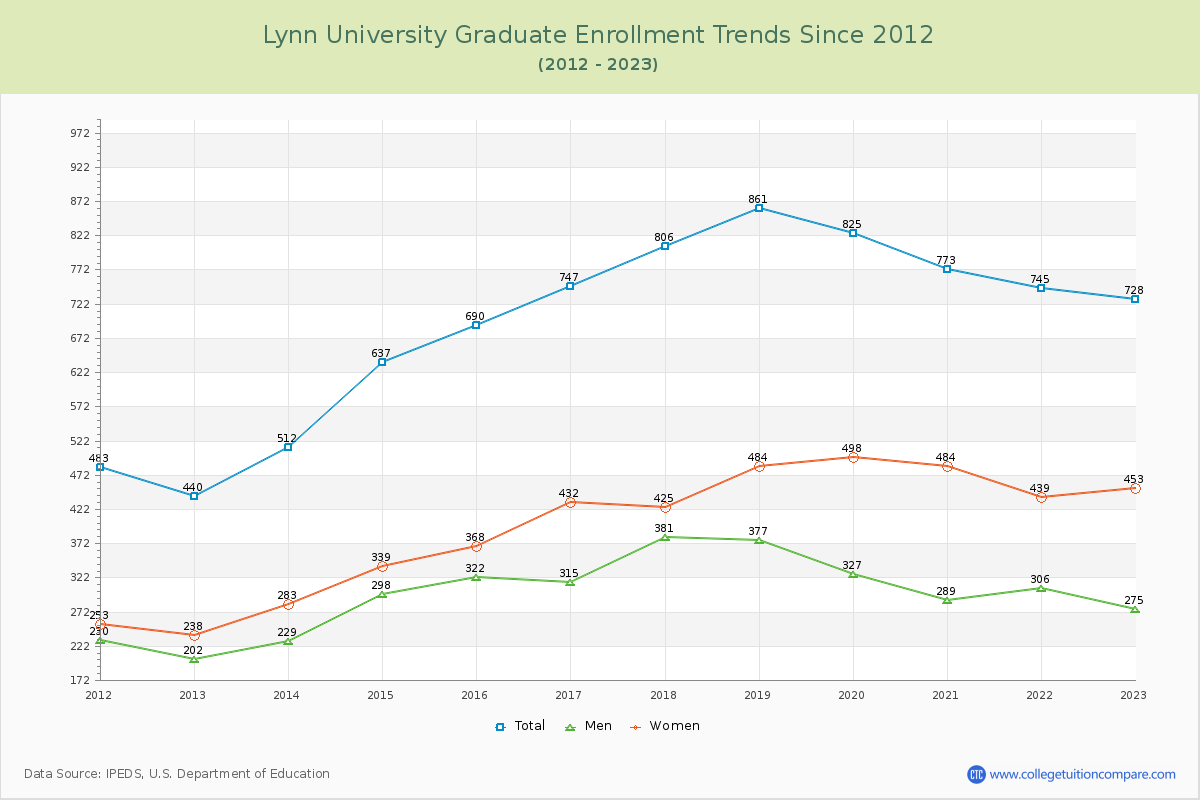
79.32% of total students is undergraduate students and 20.68% students is graduate students. The number of undergraduate students has increased by 1,135 and the graduate enrollment has increased by 288 over past 10 years.
The female to male ratio is 1.15 to 1 and it means that there are slightly more female students enrolled in Lynn than male students.
The following table and chart illustrate the changes in student population by gender at Lynn University since 2012.
| Year | Total | Undergraduate | Graduate | ||||
|---|---|---|---|---|---|---|---|
| Total | Men | Women | Total | Men | Women | ||
| 2012-13 | 2,097 | 1,657 | 865 | 792 | 440 | 202 | 238 |
| 2013-14 | 2,297 200 | 1,785 128 | 945 80 | 840 48 | 512 72 | 229 27 | 283 45 |
| 2014-15 | 2,613 316 | 1,976 191 | 1,056 111 | 920 80 | 637 125 | 298 69 | 339 56 |
| 2015-16 | 2,693 80 | 2,003 27 | 1,040 -16 | 963 43 | 690 53 | 322 24 | 368 29 |
| 2016-17 | 2,842 149 | 2,095 92 | 1,063 23 | 1,032 69 | 747 57 | 315 -7 | 432 64 |
| 2017-18 | 3,010 168 | 2,204 109 | 1,149 86 | 1,055 23 | 806 59 | 381 66 | 425 -7 |
| 2018-19 | 3,093 83 | 2,232 28 | 1,142 -7 | 1,090 35 | 861 55 | 377 -4 | 484 59 |
| 2019-20 | 3,247 154 | 2,422 190 | 1,205 63 | 1,217 127 | 825 -36 | 327 -50 | 498 14 |
| 2020-21 | 3,232 -15 | 2,459 37 | 1,227 22 | 1,232 15 | 773 -52 | 289 -38 | 484 -14 |
| 2021-22 | 3,385 153 | 2,640 181 | 1,319 92 | 1,321 89 | 745 -28 | 306 17 | 439 -45 |
| 2022-23 | 3,520 135 | 2,792 152 | 1,364 45 | 1,428 107 | 728 -17 | 275 -31 | 453 14 |
| Average | 2,912 | 2,206 | 1,125 | 1,081 | 706 | 302 | 404 |