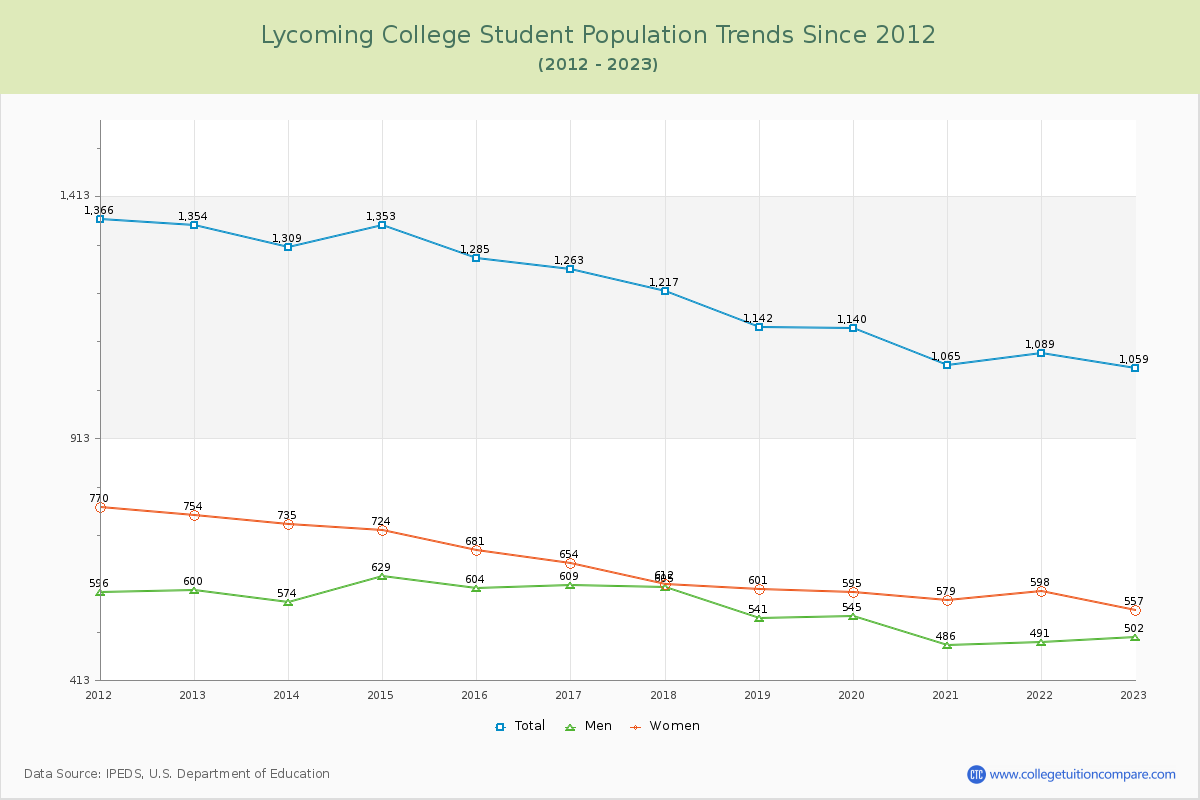
Student Population Changes
The average student population over the last 12 years is 1,207 where 1,059 students are attending the school for the academic year 2022-2023.
The female to male ratio is 1.11 to 1 and it means that there are slightly more female students enrolled in Lycoming than male students.
The following table and chart illustrate the changes in student population by gender at Lycoming College since 2012.
| Year | Total | Men | Women |
|---|---|---|---|
| 2012-13 | 1,354 | 600 | 754 |
| 2013-14 | 1,309 -45 | 574 -26 | 735 -19 |
| 2014-15 | 1,353 44 | 629 55 | 724 -11 |
| 2015-16 | 1,285 -68 | 604 -25 | 681 -43 |
| 2016-17 | 1,263 -22 | 609 5 | 654 -27 |
| 2017-18 | 1,217 -46 | 605 -4 | 612 -42 |
| 2018-19 | 1,142 -75 | 541 -64 | 601 -11 |
| 2019-20 | 1,140 -2 | 545 4 | 595 -6 |
| 2020-21 | 1,065 -75 | 486 -59 | 579 -16 |
| 2021-22 | 1,089 24 | 491 5 | 598 19 |
| 2022-23 | 1,059 -30 | 502 11 | 557 -41 |
| Average | 1,207 | 562 | 645 |