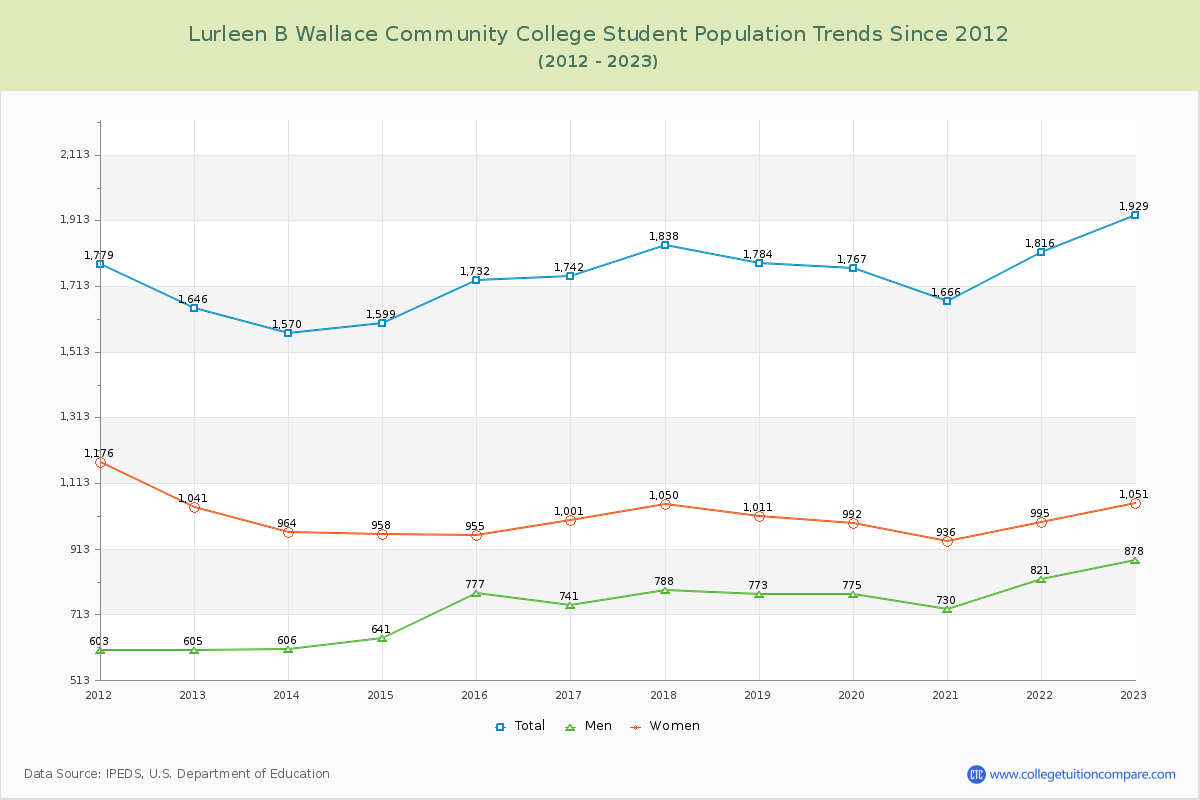
Student Population Changes
The average student population over the last 12 years is 1,735 where 1,929 students are attending the school for the academic year 2022-2023.
The female to male ratio is 1.20 to 1 and it means that there are slightly more female students enrolled in LBWCC than male students.
The following table and chart illustrate the changes in student population by gender at Lurleen B Wallace Community College since 2012.
| Year | Total | Men | Women |
|---|---|---|---|
| 2012-13 | 1,646 | 605 | 1,041 |
| 2013-14 | 1,570 -76 | 606 1 | 964 -77 |
| 2014-15 | 1,599 29 | 641 35 | 958 -6 |
| 2015-16 | 1,732 133 | 777 136 | 955 -3 |
| 2016-17 | 1,742 10 | 741 -36 | 1,001 46 |
| 2017-18 | 1,838 96 | 788 47 | 1,050 49 |
| 2018-19 | 1,784 -54 | 773 -15 | 1,011 -39 |
| 2019-20 | 1,767 -17 | 775 2 | 992 -19 |
| 2020-21 | 1,666 -101 | 730 -45 | 936 -56 |
| 2021-22 | 1,816 150 | 821 91 | 995 59 |
| 2022-23 | 1,929 113 | 878 57 | 1,051 56 |
| Average | 1,735 | 740 | 996 |