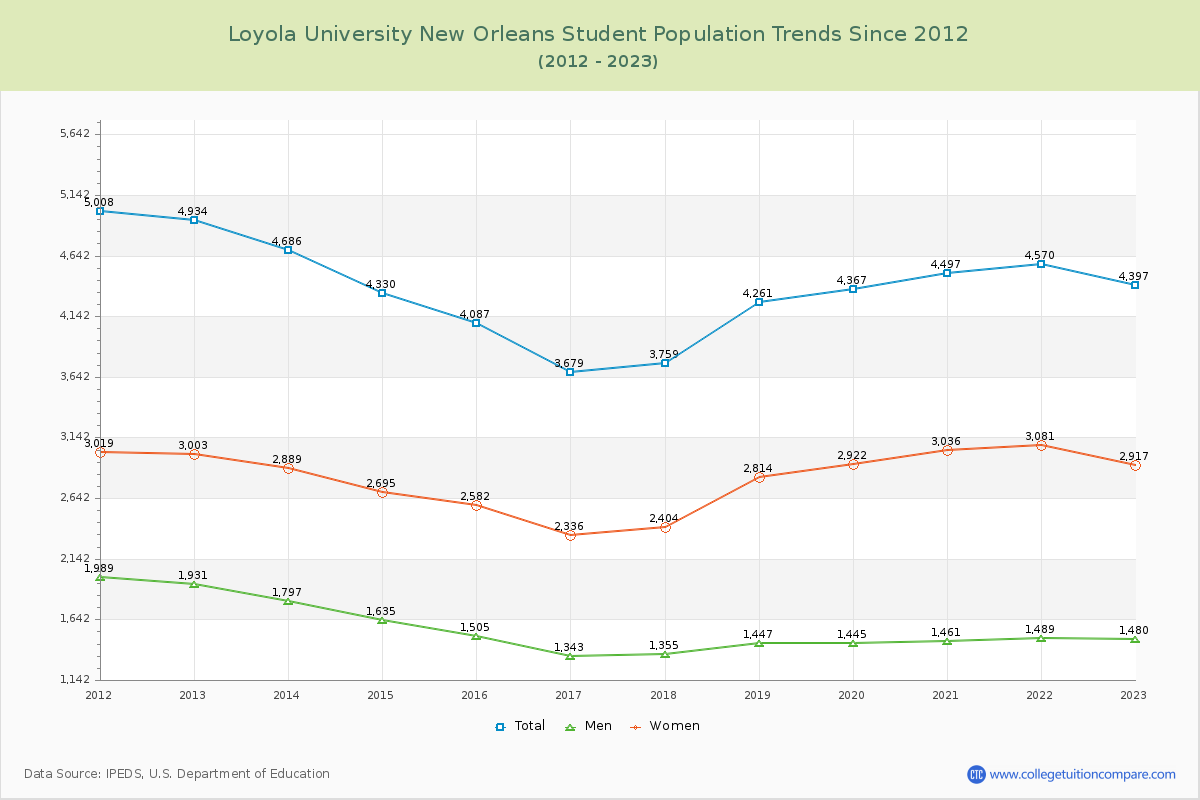
Student Population Changes
The average student population over the last 12 years is 4,324 where 4,397 students are attending the school for the academic year 2022-2023.
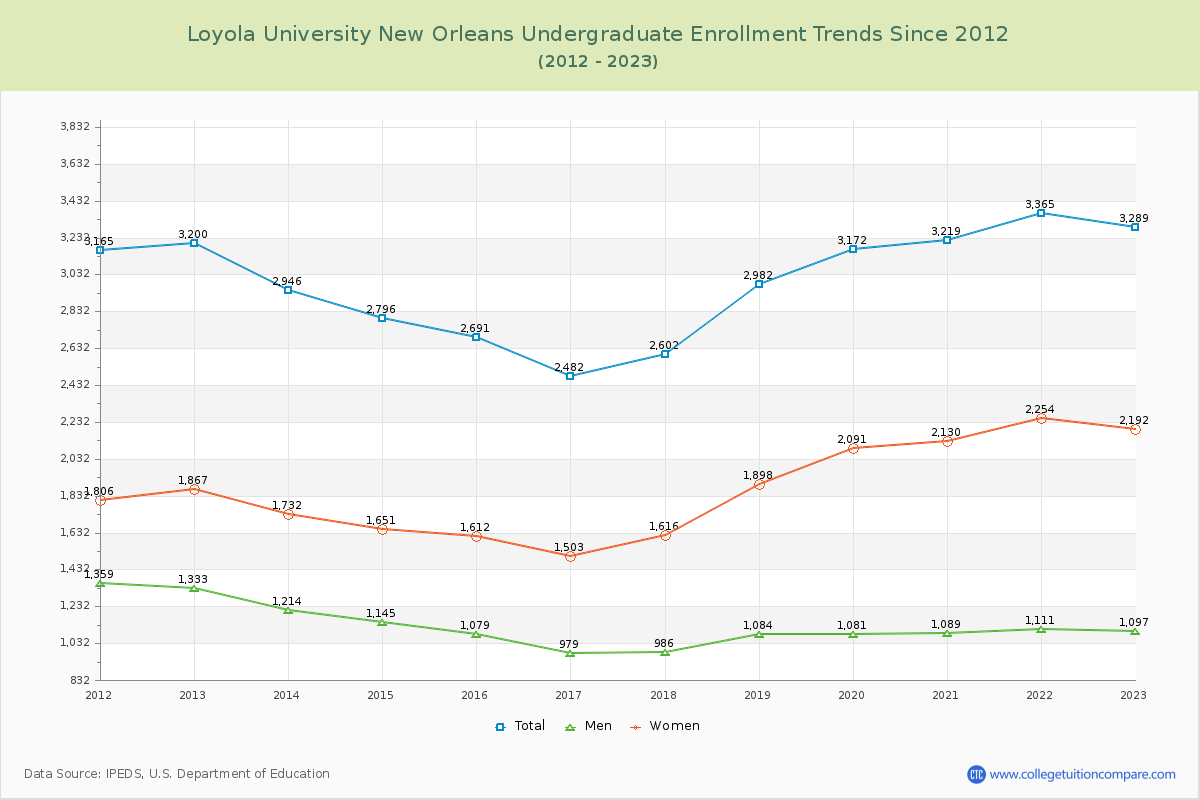
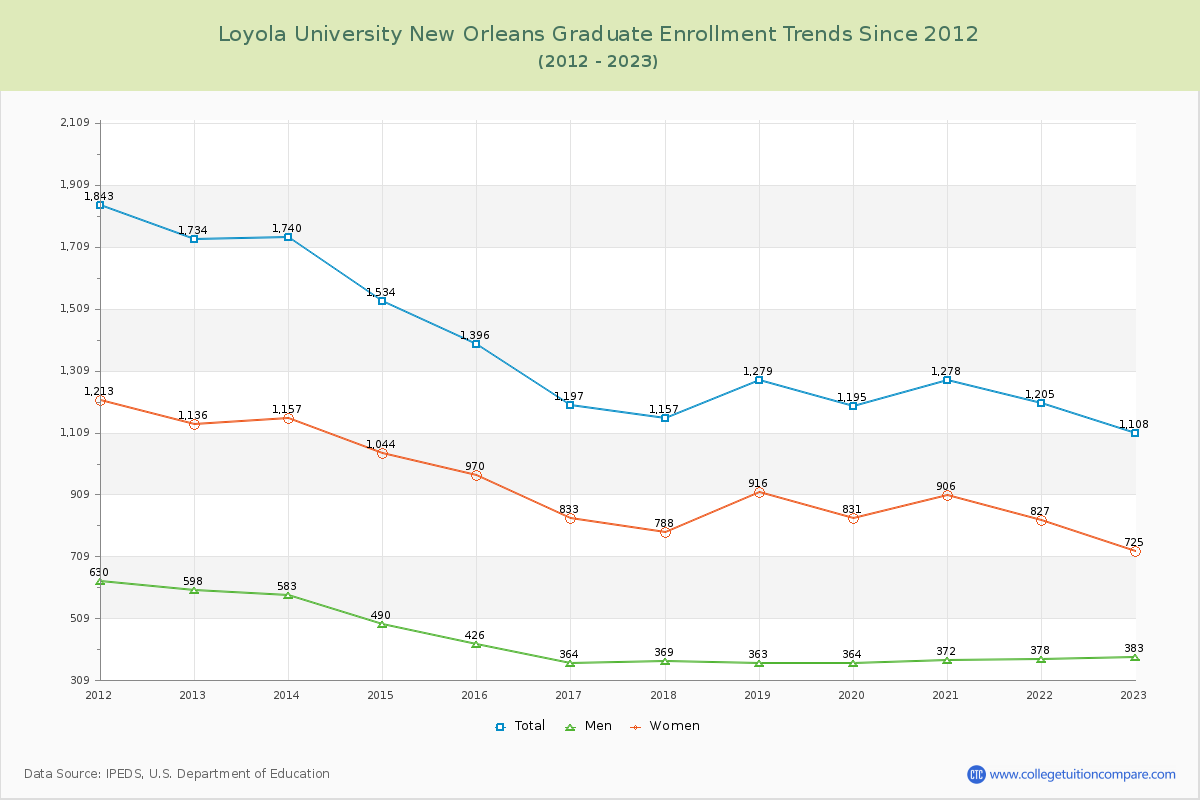
74.80% of total students is undergraduate students and 25.20% students is graduate students. The number of undergraduate students has increased by 89 and the graduate enrollment has decreased by 626 over past 10 years.
The female to male ratio is 1.97 to 1 and it means that there are more female students enrolled in Loyola University New Orleans than male students.
The following table and chart illustrate the changes in student population by gender at Loyola University New Orleans since 2012.
| Year | Total | Undergraduate | Graduate | ||||
|---|---|---|---|---|---|---|---|
| Total | Men | Women | Total | Men | Women | ||
| 2012-13 | 4,934 | 3,200 | 1,333 | 1,867 | 1,734 | 598 | 1,136 |
| 2013-14 | 4,686 -248 | 2,946 -254 | 1,214 -119 | 1,732 -135 | 1,740 6 | 583 -15 | 1,157 21 |
| 2014-15 | 4,330 -356 | 2,796 -150 | 1,145 -69 | 1,651 -81 | 1,534 -206 | 490 -93 | 1,044 -113 |
| 2015-16 | 4,087 -243 | 2,691 -105 | 1,079 -66 | 1,612 -39 | 1,396 -138 | 426 -64 | 970 -74 |
| 2016-17 | 3,679 -408 | 2,482 -209 | 979 -100 | 1,503 -109 | 1,197 -199 | 364 -62 | 833 -137 |
| 2017-18 | 3,759 80 | 2,602 120 | 986 7 | 1,616 113 | 1,157 -40 | 369 5 | 788 -45 |
| 2018-19 | 4,261 502 | 2,982 380 | 1,084 98 | 1,898 282 | 1,279 122 | 363 -6 | 916 128 |
| 2019-20 | 4,367 106 | 3,172 190 | 1,081 -3 | 2,091 193 | 1,195 -84 | 364 1 | 831 -85 |
| 2020-21 | 4,497 130 | 3,219 47 | 1,089 8 | 2,130 39 | 1,278 83 | 372 8 | 906 75 |
| 2021-22 | 4,570 73 | 3,365 146 | 1,111 22 | 2,254 124 | 1,205 -73 | 378 6 | 827 -79 |
| 2022-23 | 4,397 -173 | 3,289 -76 | 1,097 -14 | 2,192 -62 | 1,108 -97 | 383 5 | 725 -102 |
| Average | 4,324 | 2,977 | 1,109 | 1,868 | 1,348 | 426 | 921 |