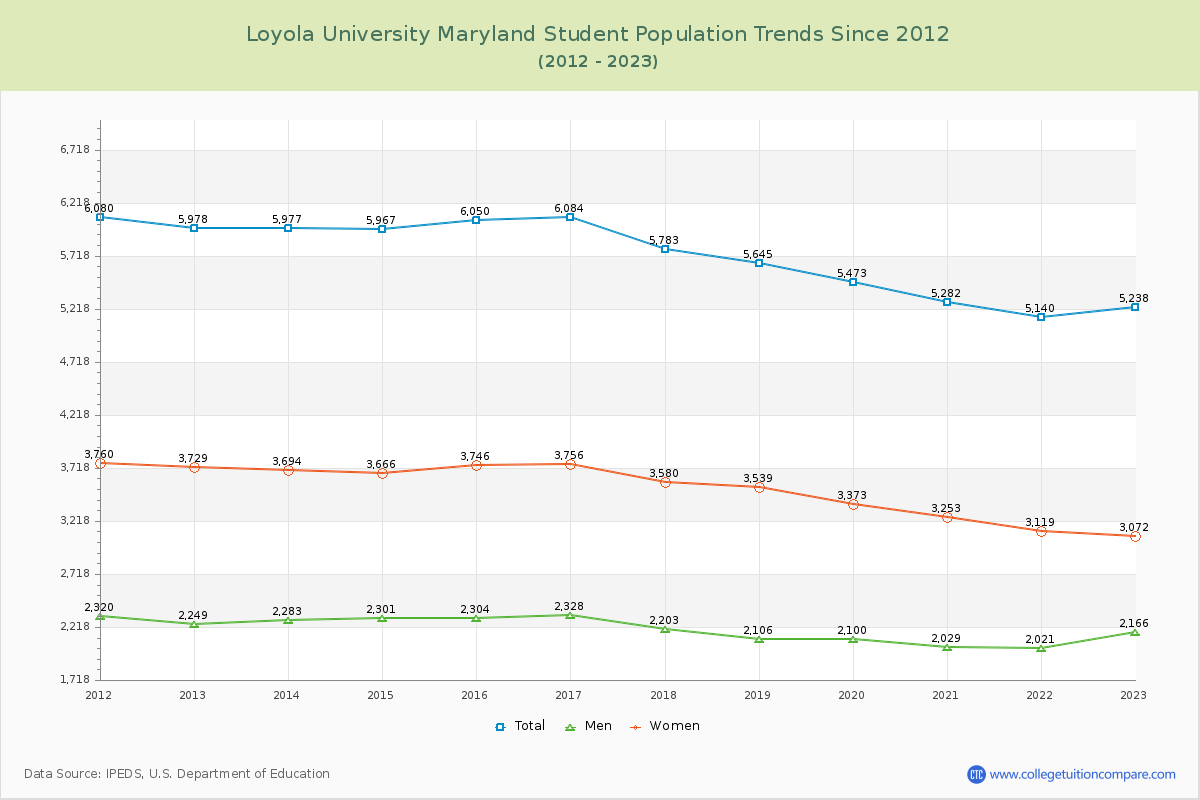
Student Population Changes
The average student population over the last 12 years is 5,692 where 5,238 students are attending the school for the academic year 2022-2023.
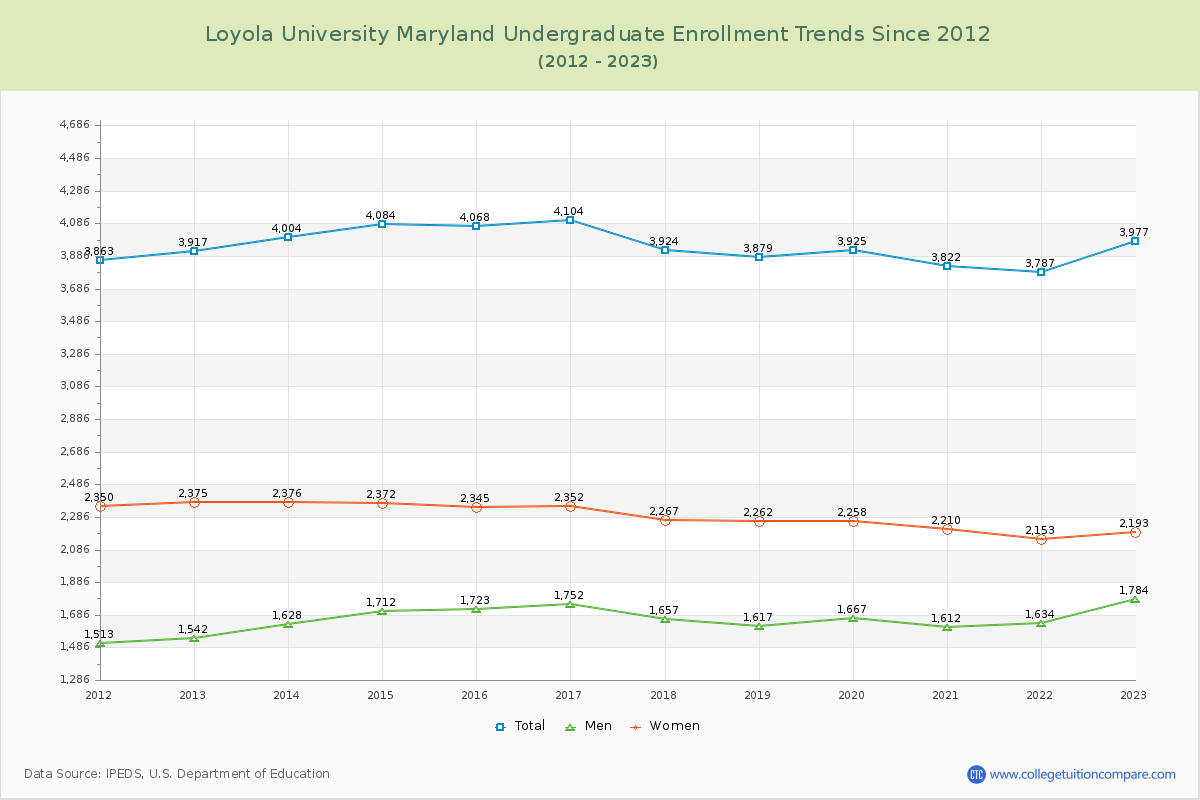
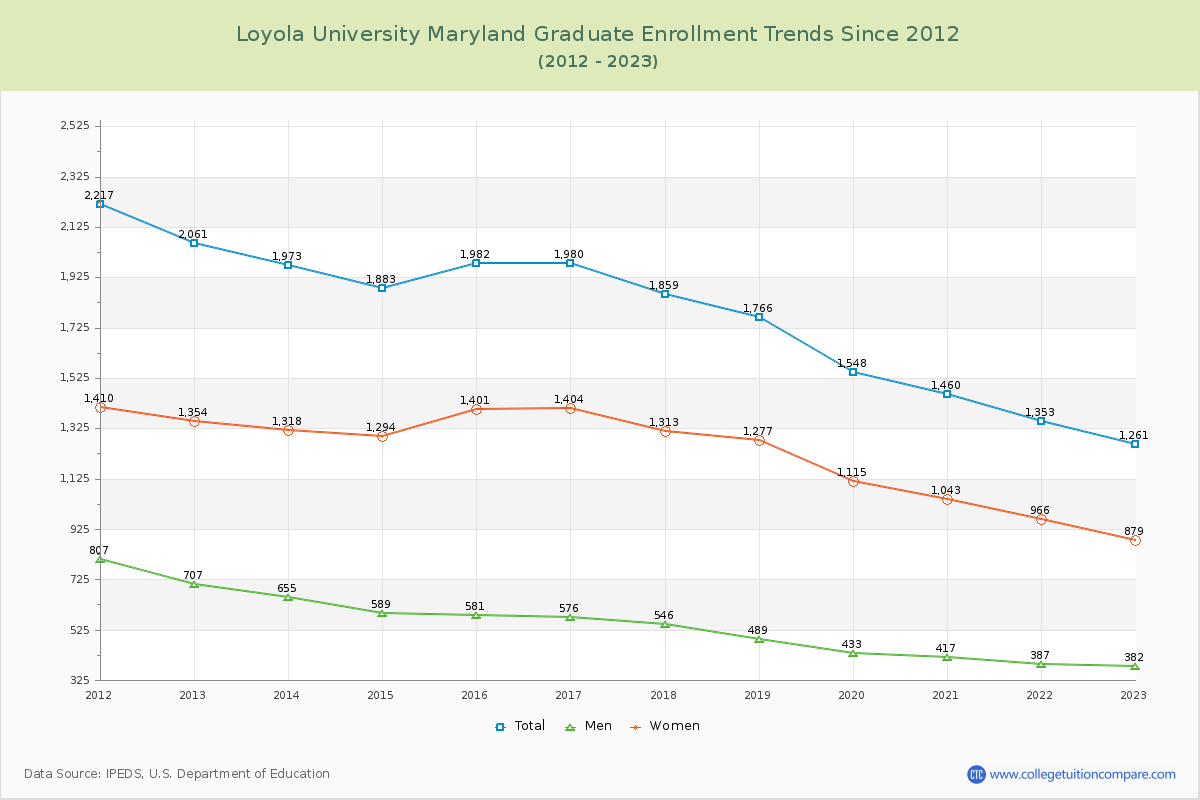
75.93% of total students is undergraduate students and 24.07% students is graduate students. The number of undergraduate students has increased by 60 and the graduate enrollment has decreased by 800 over past 10 years.
The female to male ratio is 1.42 to 1 and it means that there are more female students enrolled in Loyola University Maryland than male students.
The following table and chart illustrate the changes in student population by gender at Loyola University Maryland since 2012.
| Year | Total | Undergraduate | Graduate | ||||
|---|---|---|---|---|---|---|---|
| Total | Men | Women | Total | Men | Women | ||
| 2012-13 | 5,978 | 3,917 | 1,542 | 2,375 | 2,061 | 707 | 1,354 |
| 2013-14 | 5,977 -1 | 4,004 87 | 1,628 86 | 2,376 1 | 1,973 -88 | 655 -52 | 1,318 -36 |
| 2014-15 | 5,967 -10 | 4,084 80 | 1,712 84 | 2,372 -4 | 1,883 -90 | 589 -66 | 1,294 -24 |
| 2015-16 | 6,050 83 | 4,068 -16 | 1,723 11 | 2,345 -27 | 1,982 99 | 581 -8 | 1,401 107 |
| 2016-17 | 6,084 34 | 4,104 36 | 1,752 29 | 2,352 7 | 1,980 -2 | 576 -5 | 1,404 3 |
| 2017-18 | 5,783 -301 | 3,924 -180 | 1,657 -95 | 2,267 -85 | 1,859 -121 | 546 -30 | 1,313 -91 |
| 2018-19 | 5,645 -138 | 3,879 -45 | 1,617 -40 | 2,262 -5 | 1,766 -93 | 489 -57 | 1,277 -36 |
| 2019-20 | 5,473 -172 | 3,925 46 | 1,667 50 | 2,258 -4 | 1,548 -218 | 433 -56 | 1,115 -162 |
| 2020-21 | 5,282 -191 | 3,822 -103 | 1,612 -55 | 2,210 -48 | 1,460 -88 | 417 -16 | 1,043 -72 |
| 2021-22 | 5,140 -142 | 3,787 -35 | 1,634 22 | 2,153 -57 | 1,353 -107 | 387 -30 | 966 -77 |
| 2022-23 | 5,238 98 | 3,977 190 | 1,784 150 | 2,193 40 | 1,261 -92 | 382 -5 | 879 -87 |
| Average | 5,692 | 3,954 | 1,666 | 2,288 | 1,739 | 524 | 1,215 |