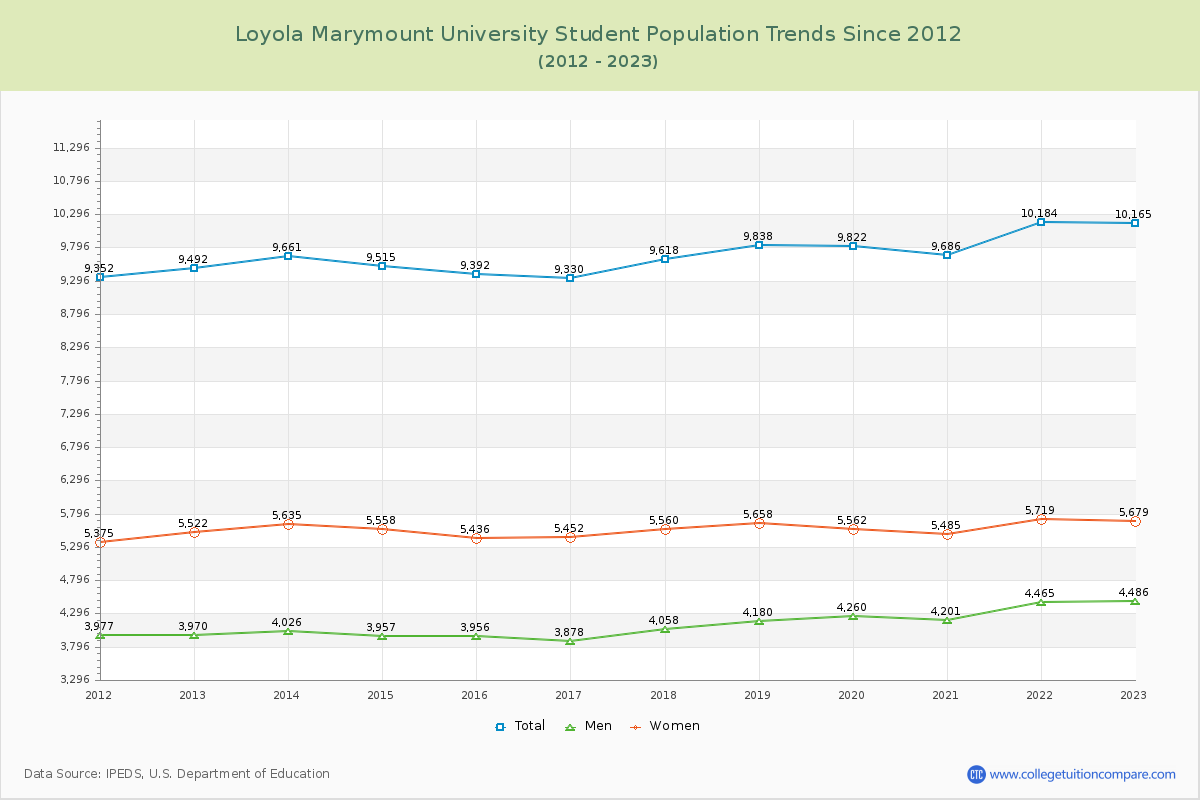
Student Population Changes
The average student population over the last 12 years is 9,700 where 10,165 students are attending the school for the academic year 2022-2023.
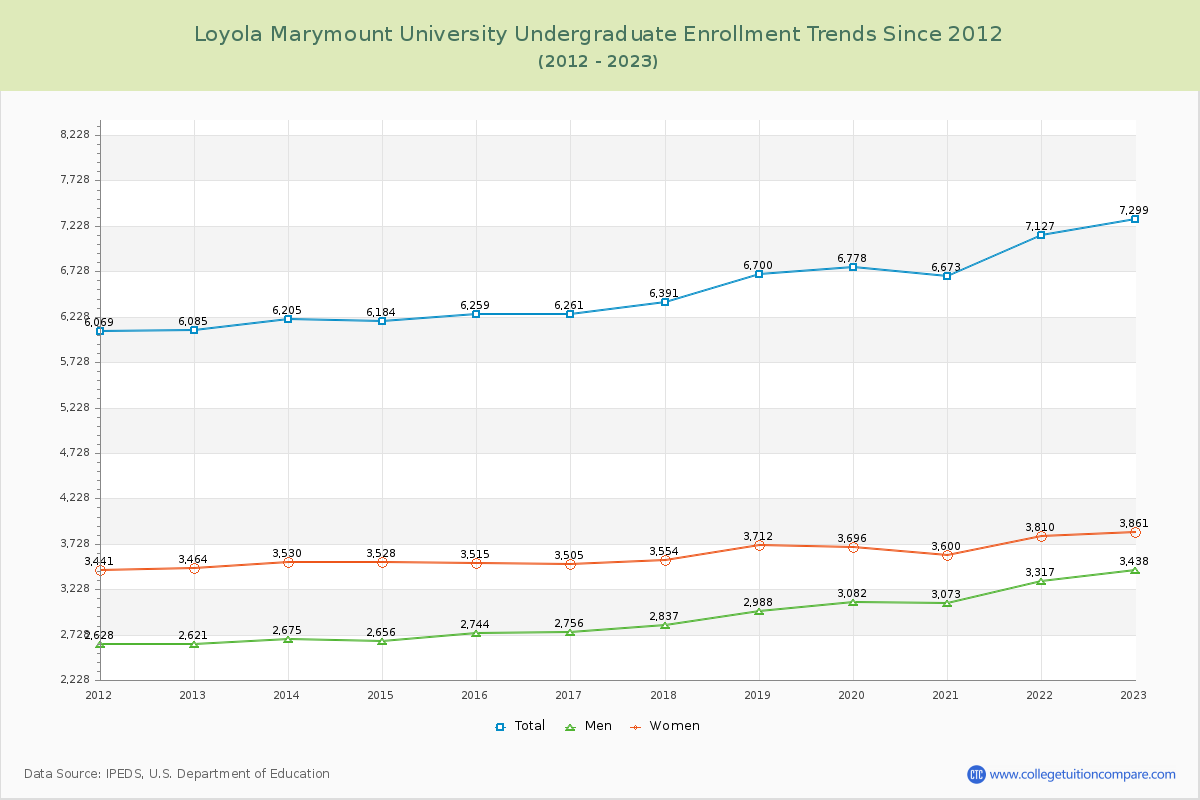
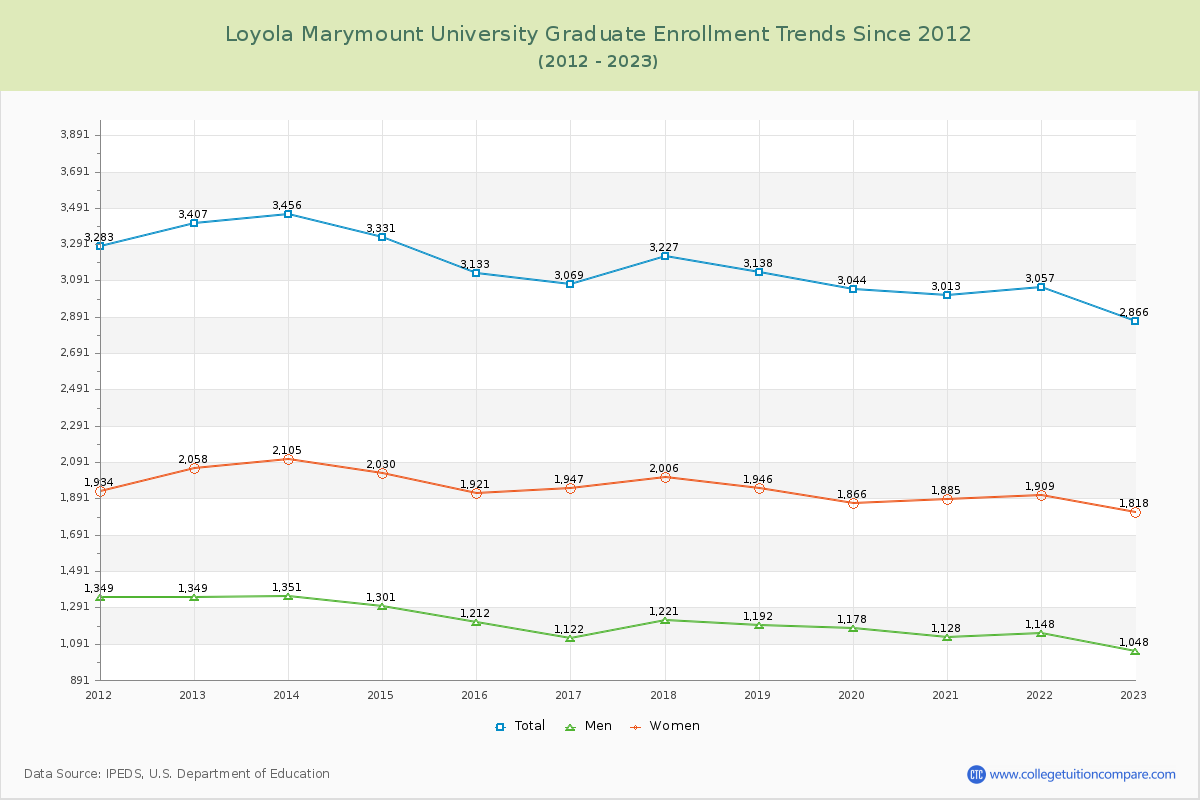
71.81% of total students is undergraduate students and 28.19% students is graduate students. The number of undergraduate students has increased by 1,214 and the graduate enrollment has decreased by 541 over past 10 years.
The female to male ratio is 1.27 to 1 and it means that there are slightly more female students enrolled in Loyola Marymount than male students.
The following table and chart illustrate the changes in student population by gender at Loyola Marymount University since 2012.
| Year | Total | Undergraduate | Graduate | ||||
|---|---|---|---|---|---|---|---|
| Total | Men | Women | Total | Men | Women | ||
| 2012-13 | 9,492 | 6,085 | 2,621 | 3,464 | 3,407 | 1,349 | 2,058 |
| 2013-14 | 9,661 169 | 6,205 120 | 2,675 54 | 3,530 66 | 3,456 49 | 1,351 2 | 2,105 47 |
| 2014-15 | 9,515 -146 | 6,184 -21 | 2,656 -19 | 3,528 -2 | 3,331 -125 | 1,301 -50 | 2,030 -75 |
| 2015-16 | 9,392 -123 | 6,259 75 | 2,744 88 | 3,515 -13 | 3,133 -198 | 1,212 -89 | 1,921 -109 |
| 2016-17 | 9,330 -62 | 6,261 2 | 2,756 12 | 3,505 -10 | 3,069 -64 | 1,122 -90 | 1,947 26 |
| 2017-18 | 9,618 288 | 6,391 130 | 2,837 81 | 3,554 49 | 3,227 158 | 1,221 99 | 2,006 59 |
| 2018-19 | 9,838 220 | 6,700 309 | 2,988 151 | 3,712 158 | 3,138 -89 | 1,192 -29 | 1,946 -60 |
| 2019-20 | 9,822 -16 | 6,778 78 | 3,082 94 | 3,696 -16 | 3,044 -94 | 1,178 -14 | 1,866 -80 |
| 2020-21 | 9,686 -136 | 6,673 -105 | 3,073 -9 | 3,600 -96 | 3,013 -31 | 1,128 -50 | 1,885 19 |
| 2021-22 | 10,184 498 | 7,127 454 | 3,317 244 | 3,810 210 | 3,057 44 | 1,148 20 | 1,909 24 |
| 2022-23 | 10,165 -19 | 7,299 172 | 3,438 121 | 3,861 51 | 2,866 -191 | 1,048 -100 | 1,818 -91 |
| Average | 9,700 | 6,542 | 2,926 | 3,616 | 3,158 | 1,205 | 1,954 |