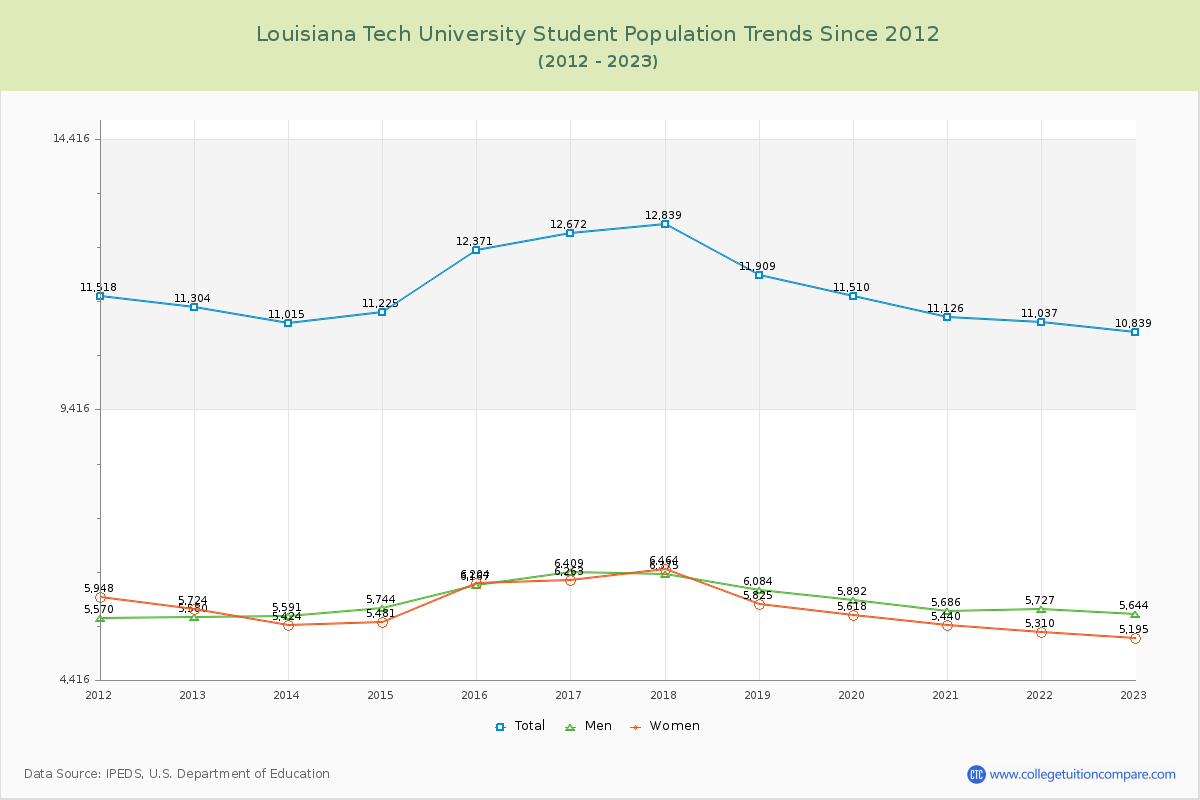
Student Population Changes
The average student population over the last 12 years is 11,622 where 10,839 students are attending the school for the academic year 2022-2023.
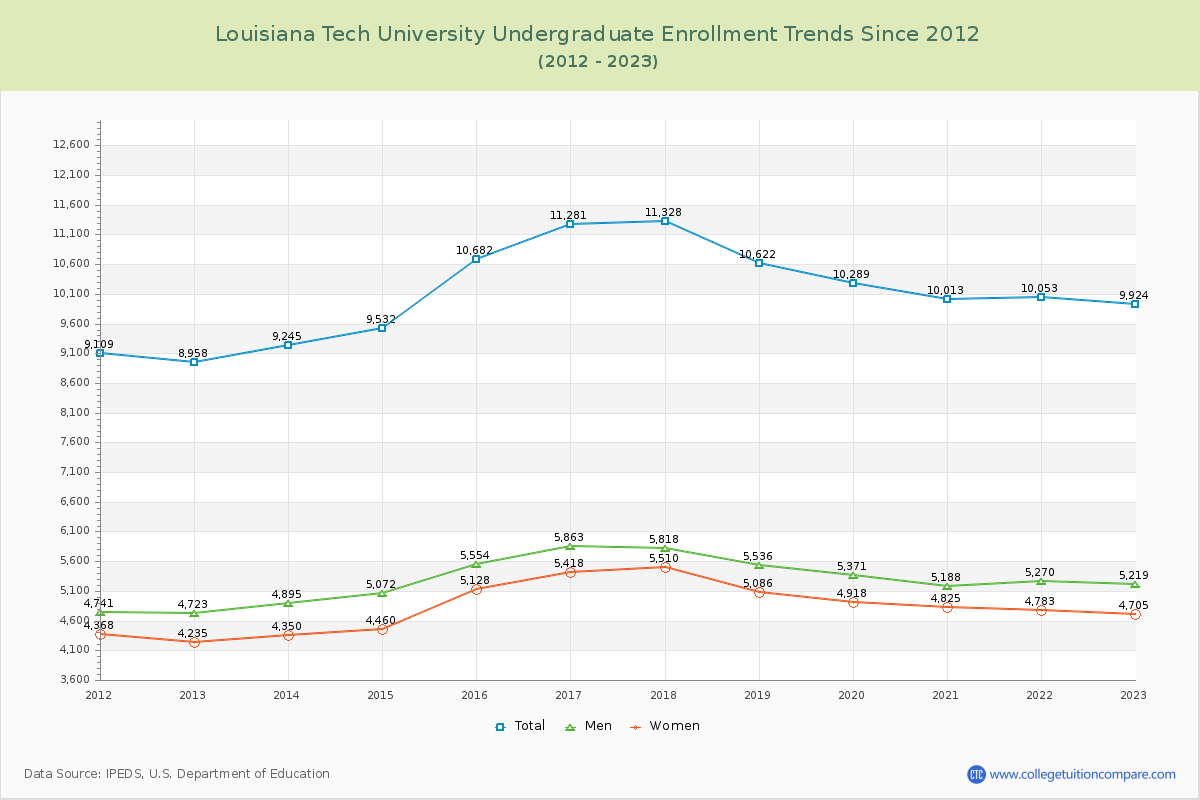
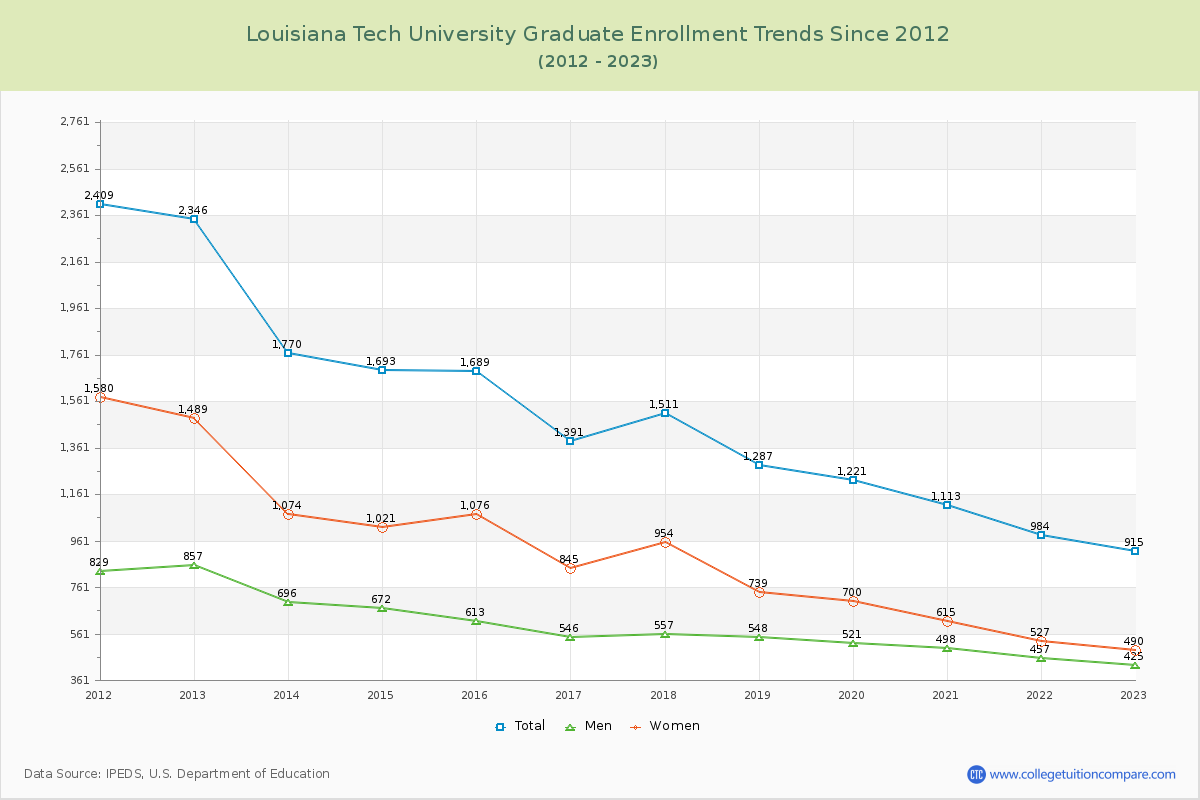
91.56% of total students is undergraduate students and 8.44% students is graduate students. The number of undergraduate students has increased by 966 and the graduate enrollment has decreased by 1,431 over past 10 years.
The female to male ratio is 0.92 to 1 and it means that there are similar numbers of female and male students enrolled in LA Tech.
The following table and chart illustrate the changes in student population by gender at Louisiana Tech University since 2012.
| Year | Total | Undergraduate | Graduate | ||||
|---|---|---|---|---|---|---|---|
| Total | Men | Women | Total | Men | Women | ||
| 2012-13 | 11,304 | 8,958 | 4,723 | 4,235 | 2,346 | 857 | 1,489 |
| 2013-14 | 11,015 -289 | 9,245 287 | 4,895 172 | 4,350 115 | 1,770 -576 | 696 -161 | 1,074 -415 |
| 2014-15 | 11,225 210 | 9,532 287 | 5,072 177 | 4,460 110 | 1,693 -77 | 672 -24 | 1,021 -53 |
| 2015-16 | 12,371 1,146 | 10,682 1,150 | 5,554 482 | 5,128 668 | 1,689 -4 | 613 -59 | 1,076 55 |
| 2016-17 | 12,672 301 | 11,281 599 | 5,863 309 | 5,418 290 | 1,391 -298 | 546 -67 | 845 -231 |
| 2017-18 | 12,839 167 | 11,328 47 | 5,818 -45 | 5,510 92 | 1,511 120 | 557 11 | 954 109 |
| 2018-19 | 11,909 -930 | 10,622 -706 | 5,536 -282 | 5,086 -424 | 1,287 -224 | 548 -9 | 739 -215 |
| 2019-20 | 11,510 -399 | 10,289 -333 | 5,371 -165 | 4,918 -168 | 1,221 -66 | 521 -27 | 700 -39 |
| 2020-21 | 11,126 -384 | 10,013 -276 | 5,188 -183 | 4,825 -93 | 1,113 -108 | 498 -23 | 615 -85 |
| 2021-22 | 11,037 -89 | 10,053 40 | 5,270 82 | 4,783 -42 | 984 -129 | 457 -41 | 527 -88 |
| 2022-23 | 10,839 -198 | 9,924 -129 | 5,219 -51 | 4,705 -78 | 915 -69 | 425 -32 | 490 -37 |
| Average | 11,622 | 10,175 | 5,319 | 4,856 | 1,447 | 581 | 866 |