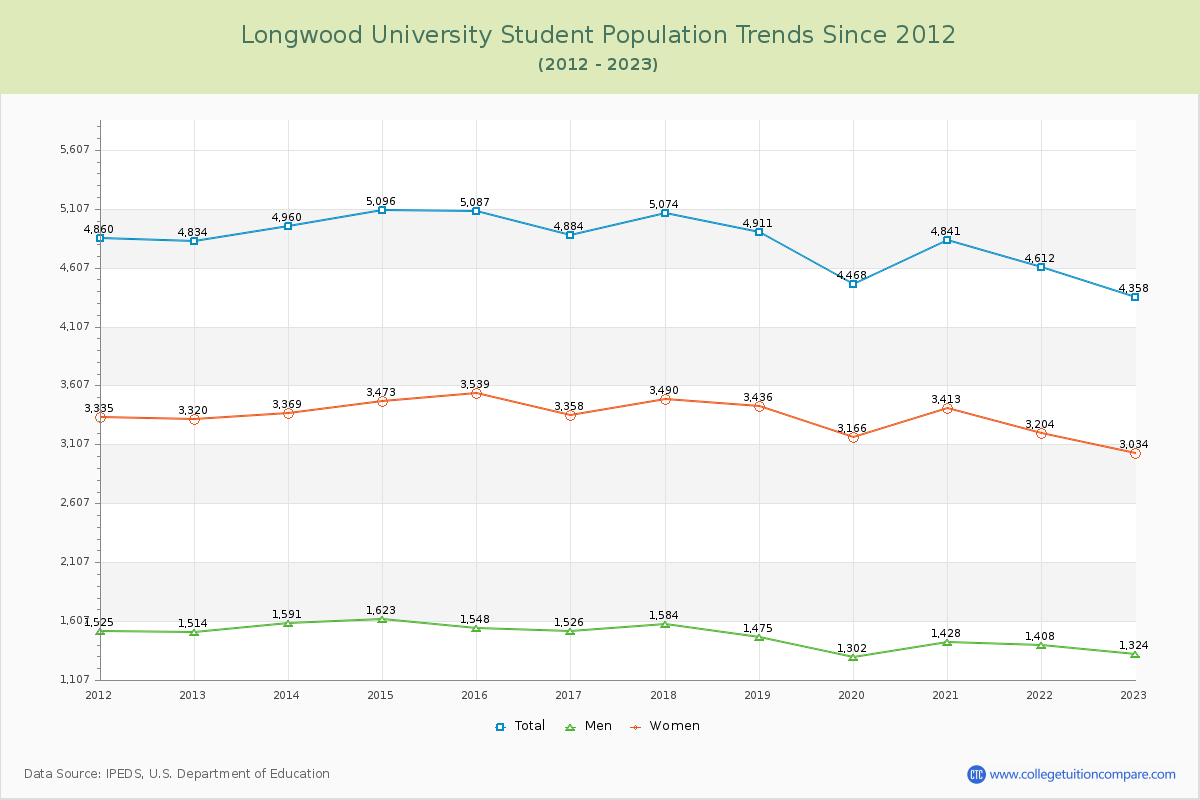
Student Population Changes
The average student population over the last 12 years is 4,830 where 4,358 students are attending the school for the academic year 2022-2023.
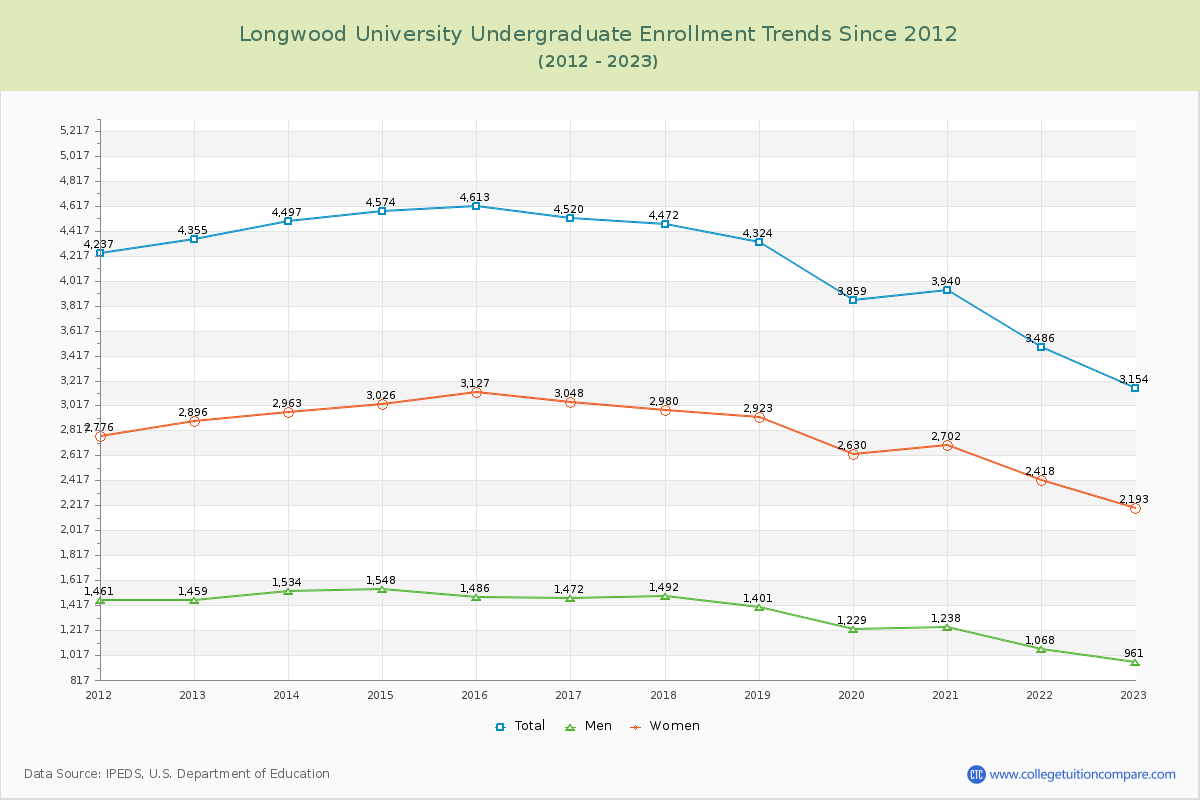
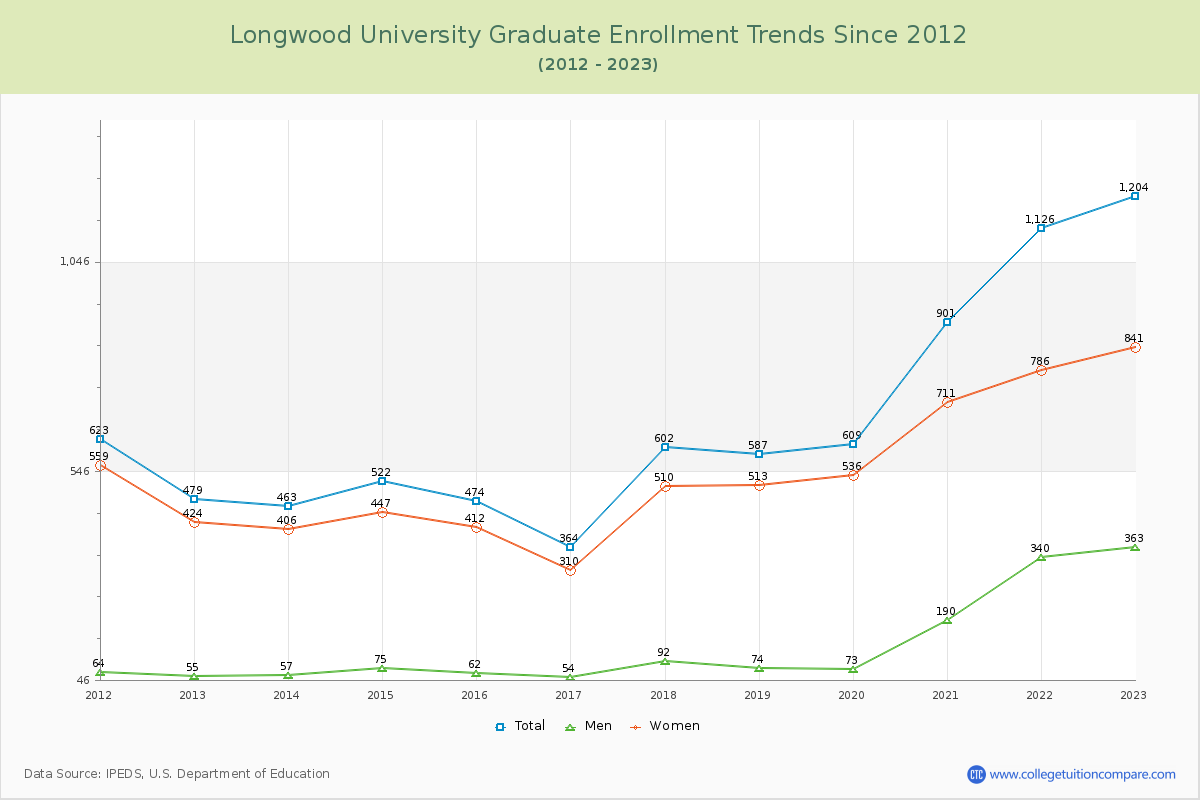
72.37% of total students is undergraduate students and 27.63% students is graduate students. The number of undergraduate students has decreased by 1,201 and the graduate enrollment has increased by 725 over past 10 years.
The female to male ratio is 2.29 to 1 and it means that there are far more female students enrolled in Longwood than male students.
The following table and chart illustrate the changes in student population by gender at Longwood University since 2012.
| Year | Total | Undergraduate | Graduate | ||||
|---|---|---|---|---|---|---|---|
| Total | Men | Women | Total | Men | Women | ||
| 2012-13 | 4,834 | 4,355 | 1,459 | 2,896 | 479 | 55 | 424 |
| 2013-14 | 4,960 126 | 4,497 142 | 1,534 75 | 2,963 67 | 463 -16 | 57 2 | 406 -18 |
| 2014-15 | 5,096 136 | 4,574 77 | 1,548 14 | 3,026 63 | 522 59 | 75 18 | 447 41 |
| 2015-16 | 5,087 -9 | 4,613 39 | 1,486 -62 | 3,127 101 | 474 -48 | 62 -13 | 412 -35 |
| 2016-17 | 4,884 -203 | 4,520 -93 | 1,472 -14 | 3,048 -79 | 364 -110 | 54 -8 | 310 -102 |
| 2017-18 | 5,074 190 | 4,472 -48 | 1,492 20 | 2,980 -68 | 602 238 | 92 38 | 510 200 |
| 2018-19 | 4,911 -163 | 4,324 -148 | 1,401 -91 | 2,923 -57 | 587 -15 | 74 -18 | 513 3 |
| 2019-20 | 4,468 -443 | 3,859 -465 | 1,229 -172 | 2,630 -293 | 609 22 | 73 -1 | 536 23 |
| 2020-21 | 4,841 373 | 3,940 81 | 1,238 9 | 2,702 72 | 901 292 | 190 117 | 711 175 |
| 2021-22 | 4,612 -229 | 3,486 -454 | 1,068 -170 | 2,418 -284 | 1,126 225 | 340 150 | 786 75 |
| 2022-23 | 4,358 -254 | 3,154 -332 | 961 -107 | 2,193 -225 | 1,204 78 | 363 23 | 841 55 |
| Average | 4,830 | 4,163 | 1,353 | 2,810 | 666 | 130 | 536 |