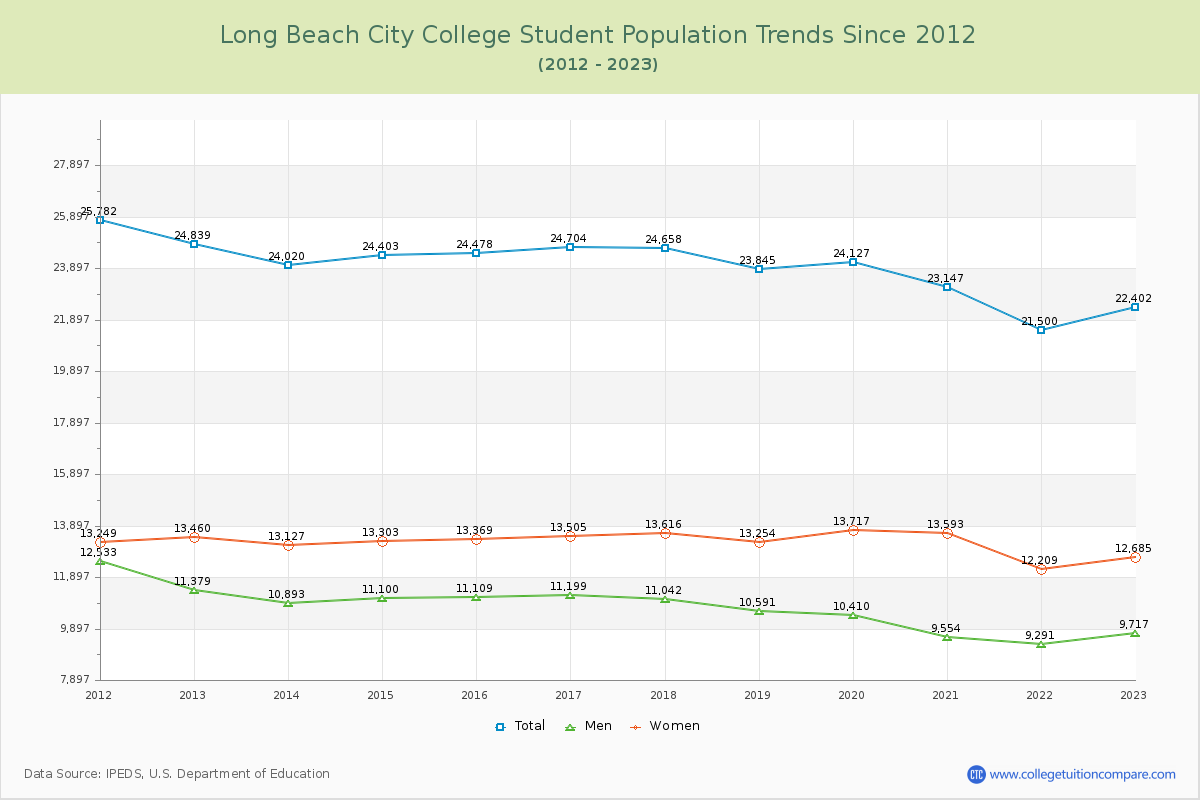
Student Population Changes
The average student population over the last 12 years is 23,829 where 22,402 students are attending the school for the academic year 2022-2023.
The female to male ratio is 1.31 to 1 and it means that there are more female students enrolled in Long Beach City than male students.
The following table and chart illustrate the changes in student population by gender at Long Beach City College since 2012.
| Year | Total | Men | Women |
|---|---|---|---|
| 2012-13 | 24,839 | 11,379 | 13,460 |
| 2013-14 | 24,020 -819 | 10,893 -486 | 13,127 -333 |
| 2014-15 | 24,403 383 | 11,100 207 | 13,303 176 |
| 2015-16 | 24,478 75 | 11,109 9 | 13,369 66 |
| 2016-17 | 24,704 226 | 11,199 90 | 13,505 136 |
| 2017-18 | 24,658 -46 | 11,042 -157 | 13,616 111 |
| 2018-19 | 23,845 -813 | 10,591 -451 | 13,254 -362 |
| 2019-20 | 24,127 282 | 10,410 -181 | 13,717 463 |
| 2020-21 | 23,147 -980 | 9,554 -856 | 13,593 -124 |
| 2021-22 | 21,500 -1,647 | 9,291 -263 | 12,209 -1,384 |
| 2022-23 | 22,402 902 | 9,717 426 | 12,685 476 |
| Average | 23,829 | 10,571 | 13,258 |