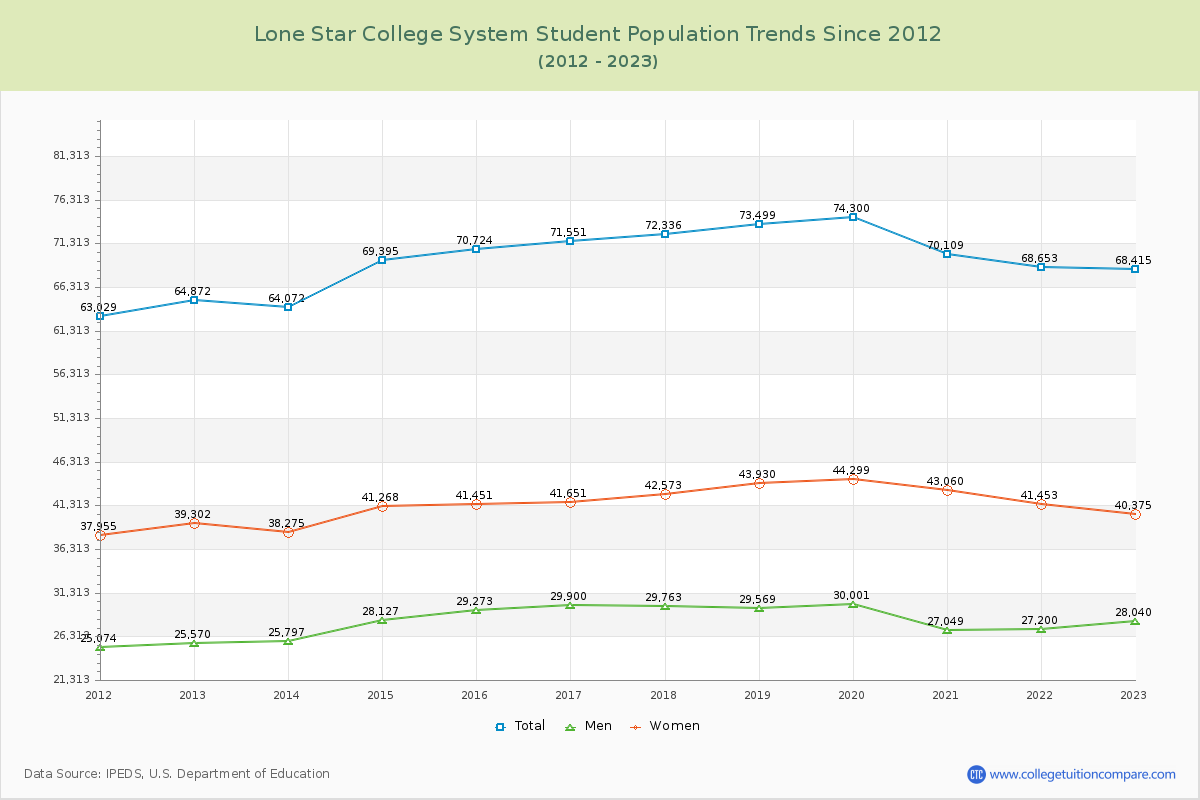
Student Population Changes
The average student population over the last 12 years is 69,811 where 68,415 students are attending the school for the academic year 2022-2023.
The female to male ratio is 1.44 to 1 and it means that there are more female students enrolled in Lone Star College System than male students.
The following table and chart illustrate the changes in student population by gender at Lone Star College System since 2012.
| Year | Total | Men | Women |
|---|---|---|---|
| 2012-13 | 64,872 | 25,570 | 39,302 |
| 2013-14 | 64,072 -800 | 25,797 227 | 38,275 -1,027 |
| 2014-15 | 69,395 5,323 | 28,127 2,330 | 41,268 2,993 |
| 2015-16 | 70,724 1,329 | 29,273 1,146 | 41,451 183 |
| 2016-17 | 71,551 827 | 29,900 627 | 41,651 200 |
| 2017-18 | 72,336 785 | 29,763 -137 | 42,573 922 |
| 2018-19 | 73,499 1,163 | 29,569 -194 | 43,930 1,357 |
| 2019-20 | 74,300 801 | 30,001 432 | 44,299 369 |
| 2020-21 | 70,109 -4,191 | 27,049 -2,952 | 43,060 -1,239 |
| 2021-22 | 68,653 -1,456 | 27,200 151 | 41,453 -1,607 |
| 2022-23 | 68,415 -238 | 28,040 840 | 40,375 -1,078 |
| Average | 69,811 | 28,208 | 41,603 |