Student Population Changes
The average student population over the last 12 years is 4,482 where 4,280 students are attending the school for the academic year 2022-2023.
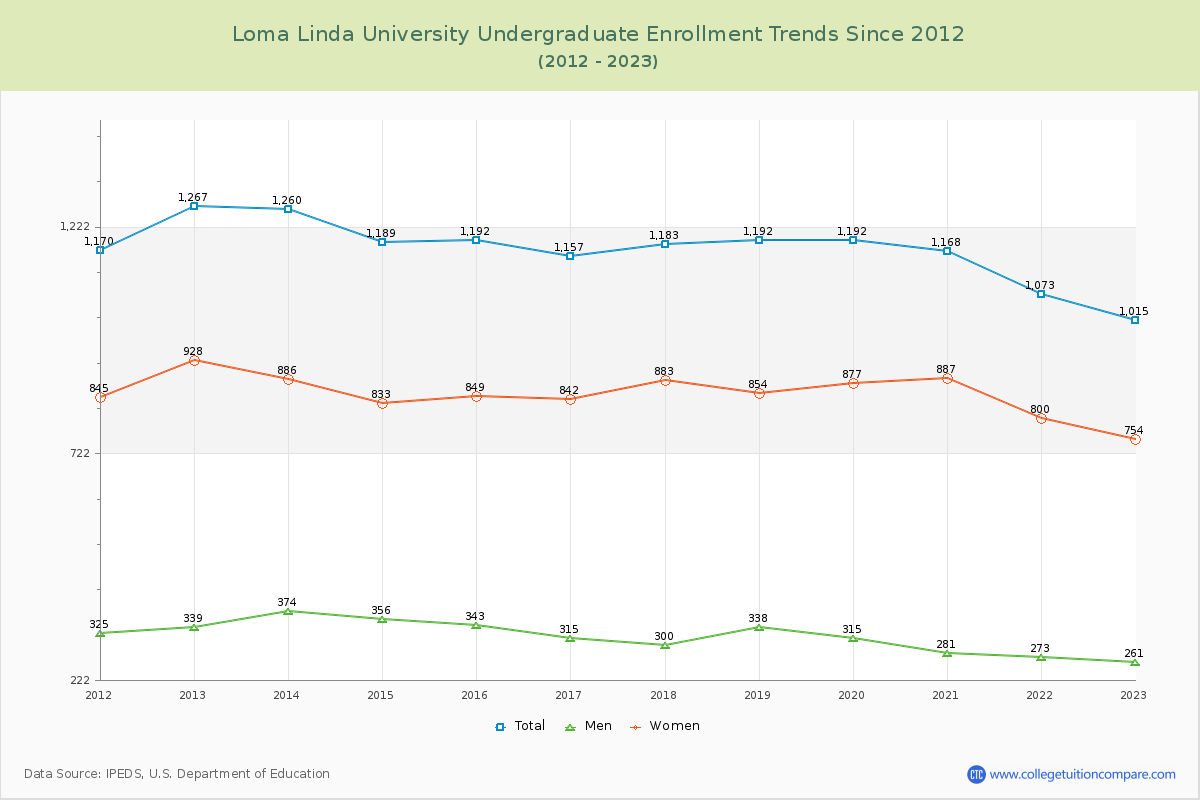
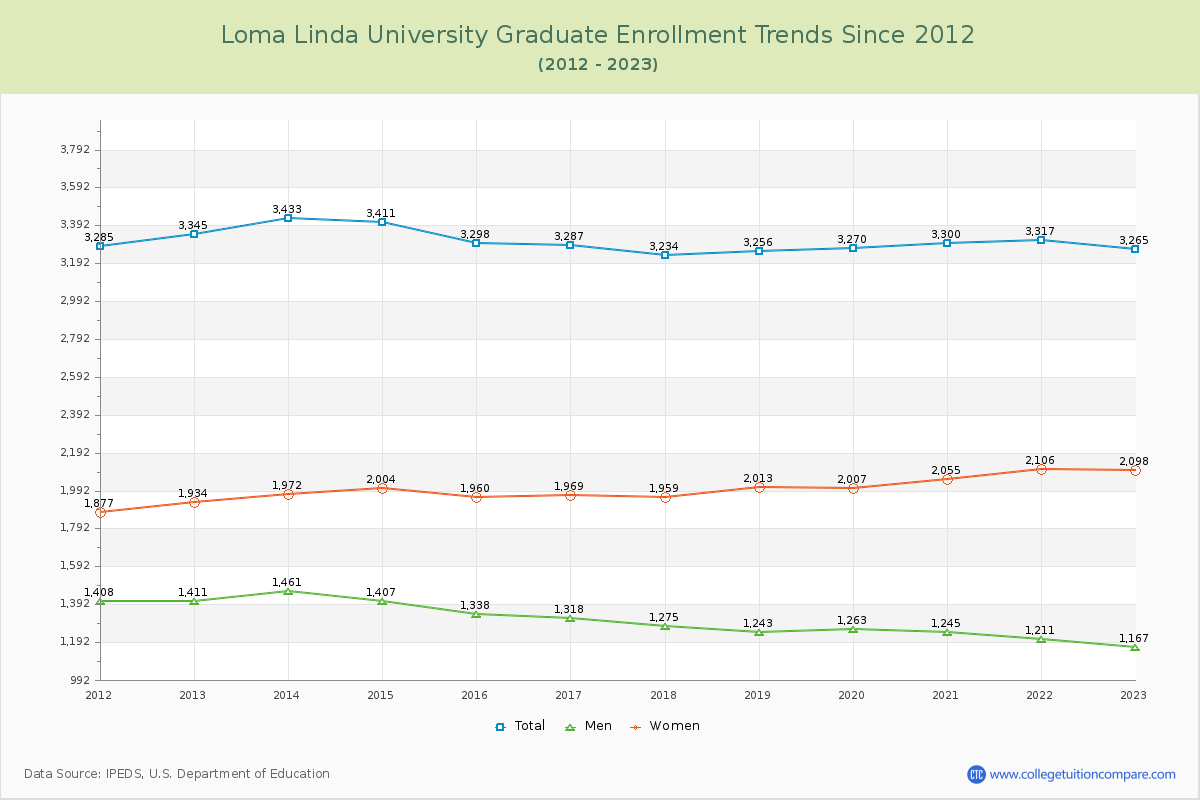
23.71% of total students is undergraduate students and 76.29% students is graduate students. The number of undergraduate students has decreased by 252 and the graduate enrollment has decreased by 80 over past 10 years.
The female to male ratio is 2.00 to 1 and it means that there are more female students enrolled in Loma Linda than male students.
The following table and chart illustrate the changes in student population by gender at Loma Linda University since 2012.
| Year | Total | Undergraduate | Graduate | ||||
|---|---|---|---|---|---|---|---|
| Total | Men | Women | Total | Men | Women | ||
| 2012-13 | 4,612 | 1,267 | 339 | 928 | 3,345 | 1,411 | 1,934 |
| 2013-14 | 4,693 81 | 1,260 -7 | 374 35 | 886 -42 | 3,433 88 | 1,461 50 | 1,972 38 |
| 2014-15 | 4,600 -93 | 1,189 -71 | 356 -18 | 833 -53 | 3,411 -22 | 1,407 -54 | 2,004 32 |
| 2015-16 | 4,490 -110 | 1,192 3 | 343 -13 | 849 16 | 3,298 -113 | 1,338 -69 | 1,960 -44 |
| 2016-17 | 4,444 -46 | 1,157 -35 | 315 -28 | 842 -7 | 3,287 -11 | 1,318 -20 | 1,969 9 |
| 2017-18 | 4,417 -27 | 1,183 26 | 300 -15 | 883 41 | 3,234 -53 | 1,275 -43 | 1,959 -10 |
| 2018-19 | 4,448 31 | 1,192 9 | 338 38 | 854 -29 | 3,256 22 | 1,243 -32 | 2,013 54 |
| 2019-20 | 4,462 14 | 1,192 0 | 315 -23 | 877 23 | 3,270 14 | 1,263 20 | 2,007 -6 |
| 2020-21 | 4,468 6 | 1,168 -24 | 281 -34 | 887 10 | 3,300 30 | 1,245 -18 | 2,055 48 |
| 2021-22 | 4,390 -78 | 1,073 -95 | 273 -8 | 800 -87 | 3,317 17 | 1,211 -34 | 2,106 51 |
| 2022-23 | 4,280 -110 | 1,015 -58 | 261 -12 | 754 -46 | 3,265 -52 | 1,167 -44 | 2,098 -8 |
| Average | 4,482 | 1,172 | 318 | 854 | 3,311 | 1,304 | 2,007 |