Enrollment Trends at LBCC

-479

Total Enrollment

-580

Men

101

Women

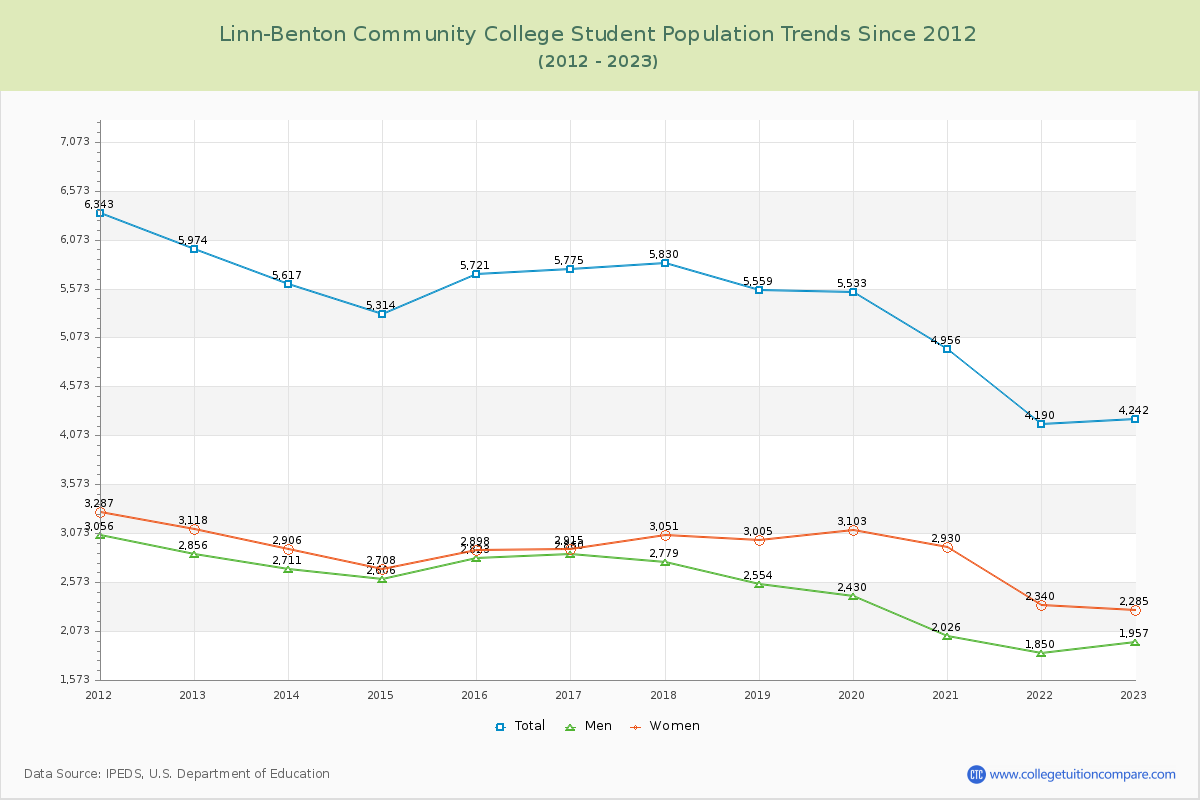
The student population at Linn-Benton Community College is 5,242 (all undergraduate). The number of students has decreased by 479 over the past decade.

The female to male ratio is 1.34 to 1 which means that female students enrolled more than male students.

1,109 students enrolled in online degree program exclusively and the number of online students has increased by 588.82% since 2015.

Student Population Changes

The average student population over the last 11 years is 5,193 where 5,242 students are attending the school for the academic year 2024-2025.

The female to male ratio is 1.34 to 1 and it means that there are more female students enrolled in LBCC than male students.

The following table and chart illustrate the changes in student population by gender at Linn-Benton Community College since 2015.

YearTotalMenWomen
2015-165,7212,8232,898
2016-175,775
54
2,860
37
2,915
17
2017-185,830
55
2,779
-81
3,051
136
2018-195,559
-271
2,554
-225
3,005
-46
2019-205,533
-26
2,430
-124
3,103
98
2020-214,956
-577
2,026
-404
2,930
-173
2021-224,190
-766
1,850
-176
2,340
-590
2022-234,242
52
1,957
107
2,285
-55
2023-244,881
639
2,174
217
2,707
422
2024-255,242
361
2,243
69
2,999
292
Average5,1932,3702,823
Linn-Benton Community College Enrollment Trends Chart

Enrollment by Race/Ethnicity Changes

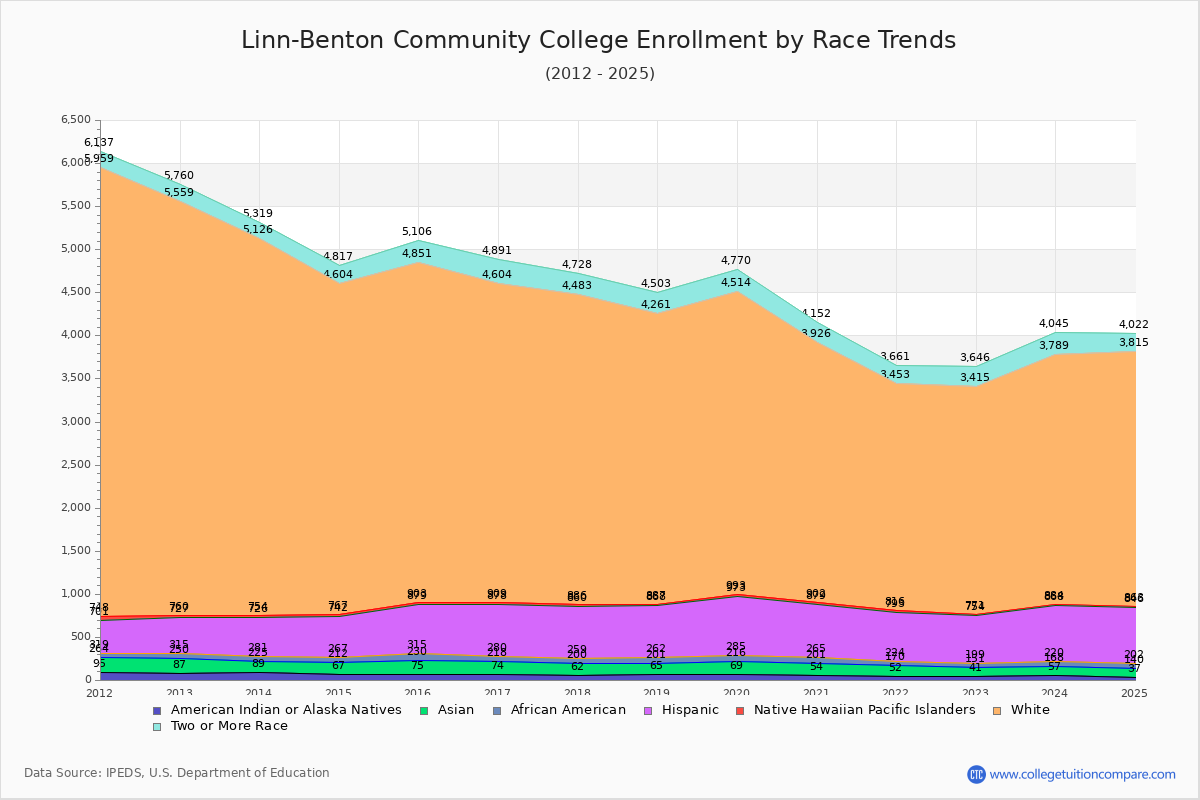
The percentage of white students is 56.31%. The percentage was 69.01% 10 years ago and LBCC still has a high percentage of white students. 1.96% of enrolled students is Asian and 1.18% is black students. Hispanic students comprise 12.29% of the student body.

Over the past 10 years, the racial composition has shifted. The percentage of white students decreased from 69.01% to 56.31%. Asian enrollment declined from 2.71% to 1.96%. Black student enrollment decreased from 1.49% to 1.18%. Hispanic student representation expanded from 9.86% to 12.29%.

The overall racial diversity, measured by the Census Bureau Diversity Index, is 0.6656 which indicates that moderately diverse. This increased from 0.5109 a decade ago, suggesting that racial diversity has improved.

The following table and chart illustrate the student population trends by race/ethnicity at Linn-Benton Community College over the past 11 years (2015-2025).

YearAmerican Indian or Native AmericanAsianBlackHispanicNative Hawaiian or Other Pacific IslanderWhiteTwo or More Races
2015-167515585564243,948255
2016-177414462598313,695287
2017-186213859601263,597245
2018-196513661606193,374242
2019-206914769688203,521256
2020-215414764614233,024226
2021-225211854569232,637208
2022-234111048555172,644231
2023-245711152648162,905256
2024-253710362644172,952207
Average5913162609223,230241
Linn-Benton Community College Enrollment by Race Trends Chart

Distance Learning (Online Courses) Enrollment Changes

1,109 students are enrolled in online degree programs exclusively for the academic year 2024-2025, which is 21% of total students. The number of online students has increased 588.82% since 2015. The following table and chart illustrate the changes in the online student population by enrolled type at Linn-Benton Community College from 2015 to 2025.

YearTotal EnrollmentOnline CompletelyEnrolled in Some Online CoursesNot Enrolled in Online Courses
2015-165,7211617134,847
2016-175,7752038154,757
2017-185,8301948024,834
2018-195,5591786804,701
2019-205,5332519014,381
2020-214,9563,958850148
2021-224,1902,4031,310477
2022-234,2426836092,950
2023-244,8811,1142,1421,625
2024-255,2421,1092,1002,033
Average5,1931,0251,0923,075

Ratings & Review

Share your experiences and thoughts about Linn-Benton Community College. It will be a great help to applicants and prospective students!