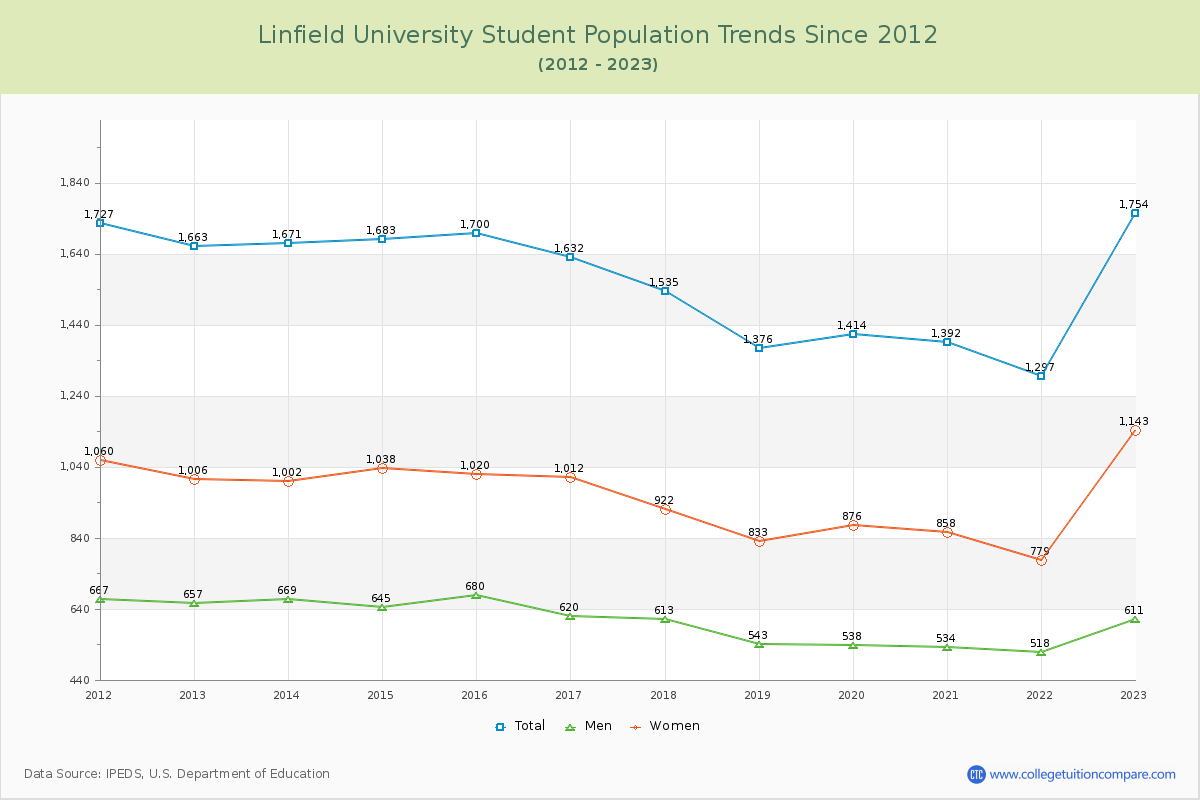
Student Population Changes
The average student population over the last 12 years is 1,556 where 1,754 students are attending the school for the academic year 2022-2023.
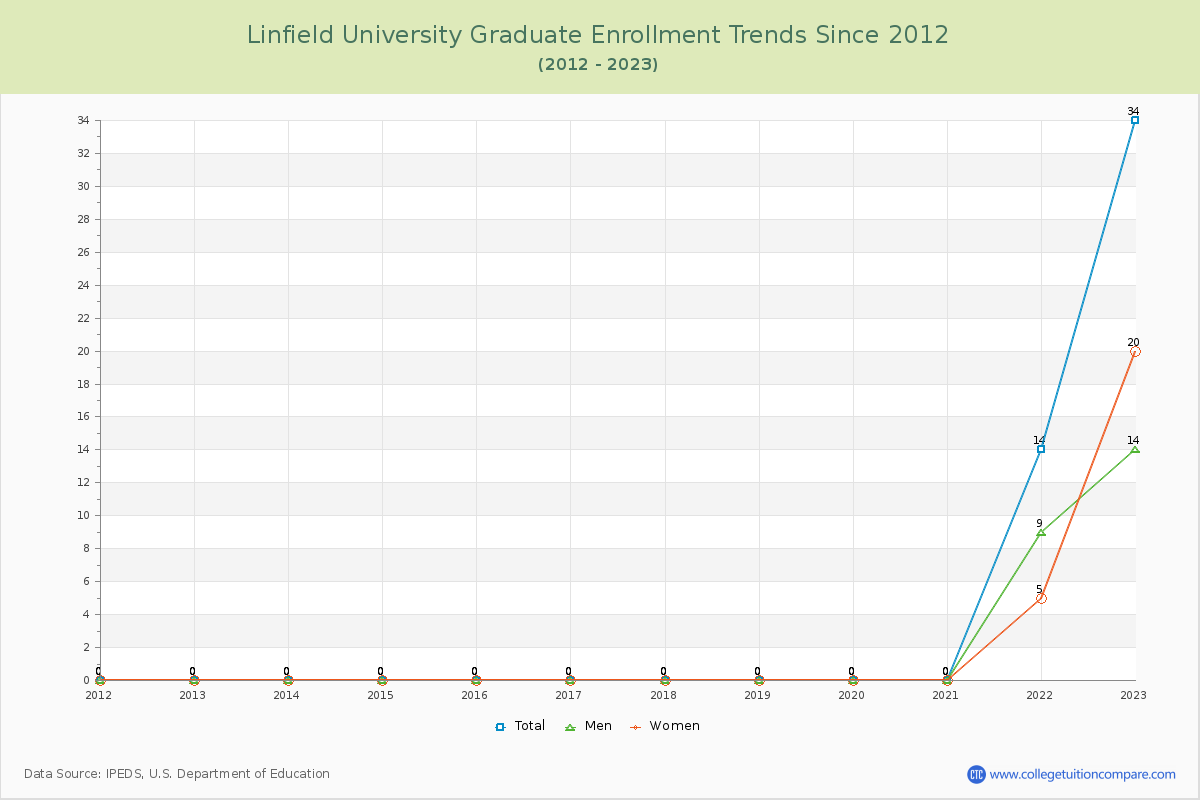
98.06% of total students is undergraduate students and 1.94% students is graduate students. The number of undergraduate students has increased by 57 and the graduate enrollment has increased by 34 over past 10 years.
The female to male ratio is 1.87 to 1 and it means that there are more female students enrolled in LC than male students.
The following table and chart illustrate the changes in student population by gender at Linfield University since 2012.
| Year | Total | Undergraduate | Graduate | ||||
|---|---|---|---|---|---|---|---|
| Total | Men | Women | Total | Men | Women | ||
| 2012-13 | 1,663 | 1,663 | 657 | 1,006 | 0 | 0 | 0 |
| 2013-14 | 1,671 8 | 1,671 8 | 669 12 | 1,002 -4 | 0 0 | 0 0 | 0 0 |
| 2014-15 | 1,683 12 | 1,683 12 | 645 -24 | 1,038 36 | 0 0 | 0 0 | 0 0 |
| 2015-16 | 1,700 17 | 1,700 17 | 680 35 | 1,020 -18 | 0 0 | 0 0 | 0 0 |
| 2016-17 | 1,632 -68 | 1,632 -68 | 620 -60 | 1,012 -8 | 0 0 | 0 0 | 0 0 |
| 2017-18 | 1,535 -97 | 1,535 -97 | 613 -7 | 922 -90 | 0 0 | 0 0 | 0 0 |
| 2018-19 | 1,376 -159 | 1,376 -159 | 543 -70 | 833 -89 | 0 0 | 0 0 | 0 0 |
| 2019-20 | 1,414 38 | 1,414 38 | 538 -5 | 876 43 | 0 0 | 0 0 | 0 0 |
| 2020-21 | 1,392 -22 | 1,392 -22 | 534 -4 | 858 -18 | 0 0 | 0 0 | 0 0 |
| 2021-22 | 1,297 -95 | 1,283 -109 | 509 -25 | 774 -84 | 14 14 | 9 9 | 5 5 |
| 2022-23 | 1,754 457 | 1,720 437 | 597 88 | 1,123 349 | 34 20 | 14 5 | 20 15 |
| Average | 1,556 | 1,552 | 600 | 951 | 4 | 2 | 2 |