Enrollment Trends at Lincoln Christian

-693

Total Enrollment

-392

Men

-301

Women

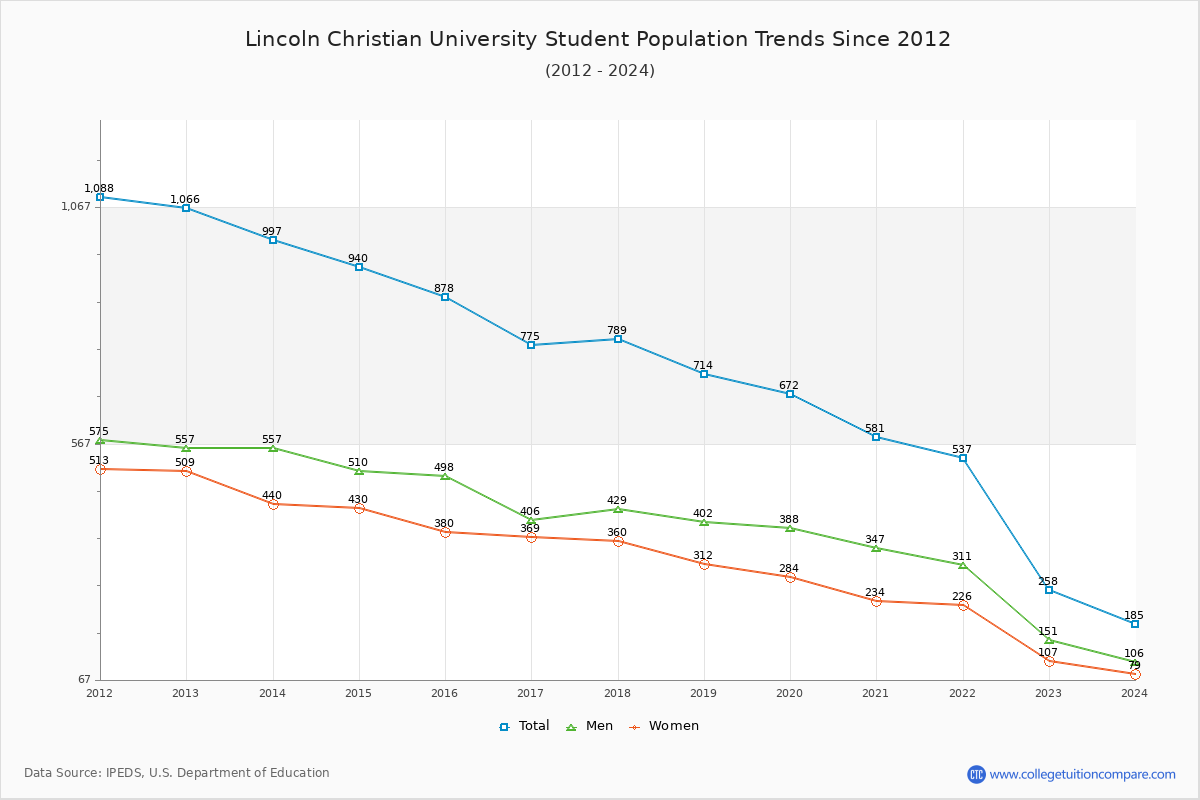
The student population at Lincoln Christian University is 185 (45 undergraduate and 140 graduate students) . The number of students has decreased by 693 over the past decade.

The percentage of undergraduate students at Lincoln Christian is 24.32% which is decreased by 483 over last 10 years. The graduate student population decreased by 210 and it has been decreasing.

The female to male ratio is 0.75 to 1 which means that male students enrolled more than female students.

72 students enrolled in online degree program exclusively and the number of online students has decreased by -67.27% since 2015.

Student Population Changes

The average student population over the last 10 years is 599 where 185 students are attending the school for the academic year 2023-2024.

24.32% of total students is undergraduate students and 75.68% students is graduate students. The number of undergraduate students has decreased by 483 and the graduate enrollment has decreased by 210 over past 10 years.

The female to male ratio is 0.75 to 1 and it means that there are more male students enrolled in Lincoln Christian than female students.

The following table and chart illustrate the changes in student population by gender at Lincoln Christian University since 2015.

YearTotalUndergraduateGraduate
TotalMenWomenTotalMenWomen
2015-16878528286242350212138
2016-17775
-103
464
-64
229
-57
235
-7
311
-39
177
-35
134
-4
2017-18789
14
466
2
229237
2
323
12
200
23
123
-11
2018-19714
-75
415
-51
206
-23
209
-28
299
-24
196
-4
103
-20
2019-20672
-42
378
-37
196
-10
182
-27
294
-5
192
-4
102
-1
2020-21581
-91
308
-70
176
-20
132
-50
273
-21
171
-21
102
2021-22537
-44
287
-21
166
-10
121
-11
250
-23
145
-26
105
3
2022-23258
-279
87
-200
51
-115
36
-85
171
-79
100
-45
71
-34
2023-24185
-73
45
-42
31
-20
14
-22
140
-31
75
-25
65
-6
Average599331174156268163105
Lincoln Christian University Enrollment Trends Chart

Undergraduate Enrollment Changes

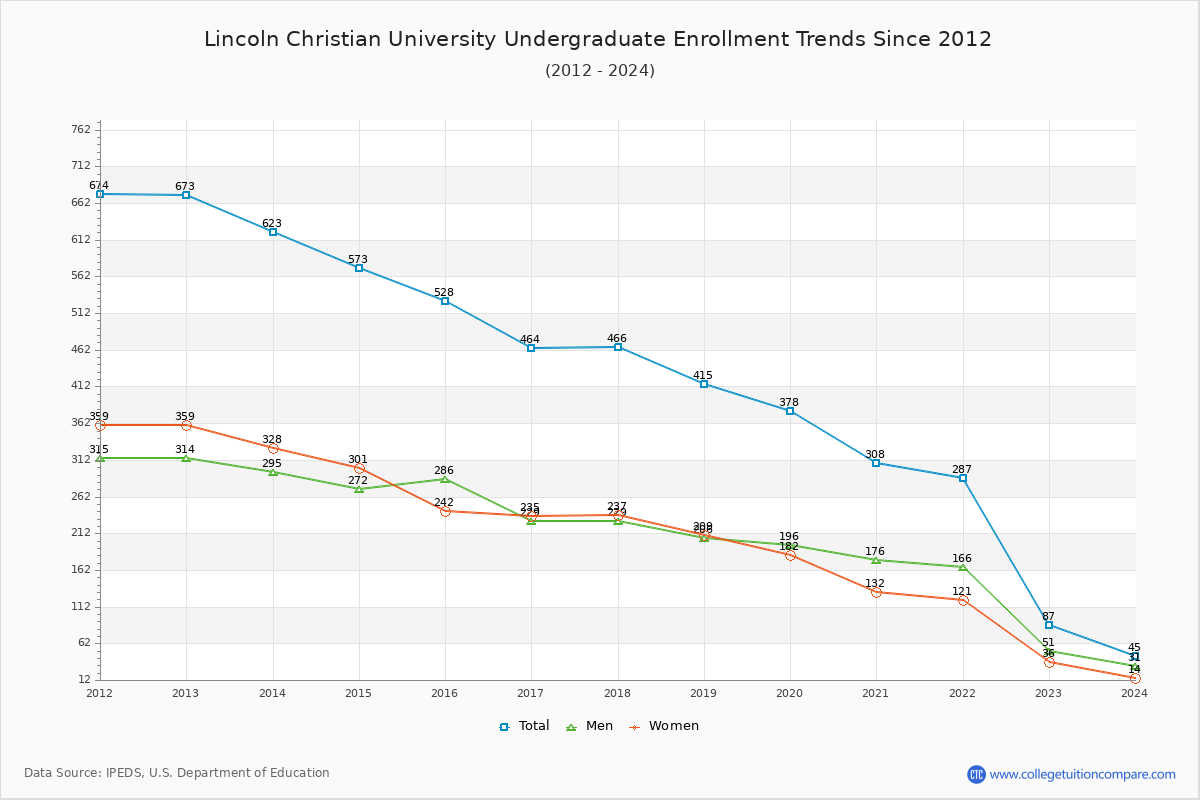
The average number of Undergraduate students over the last 10 years is 331 where 45 students are attending the Undergraduate school for the academic year 2023-2024. The following table and chart illustrate the changes in Undergraduate enrollment by attending status and gender at Lincoln Christian University since 2015.

YearTotalFull-timePart-time
TotalMenWomenTotalMenWomen
2015-165284172341831115259
2016-174643621851771024458
2017-184663491821671174770
2018-19415337175162783147
2019-20378304161143743539
2020-21308259152107492425
2021-22287237136101503020
2022-2387513120362016
2023-244521183241311
Average3313311421183313338
Lincoln Christian University Undergraduate Enrollment Trends Chart

Graduate Enrollment Changes

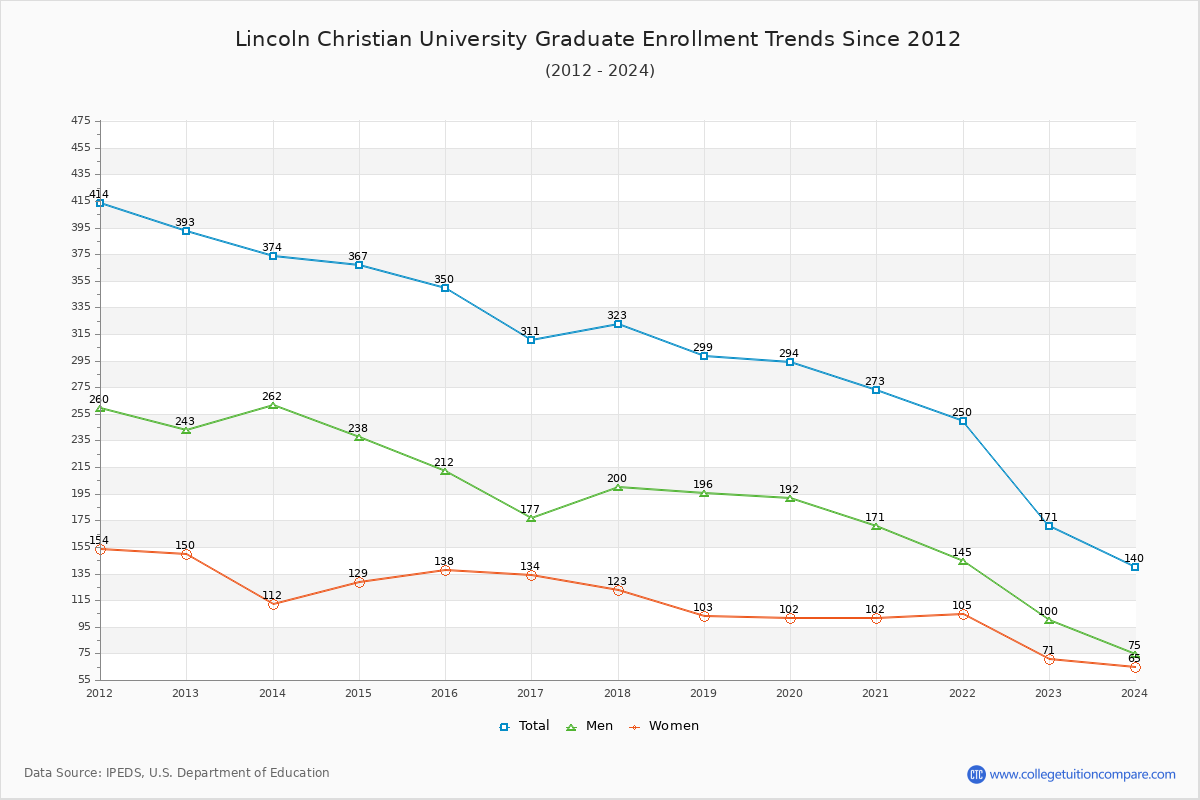
The average number of Graduate students over the last 10 years is 268 where 140 students are attending the Graduate school for the academic year 2023-2024. The following table and chart illustrate the changes in Graduate enrollment by attending status and gender at Lincoln Christian University since 2015.

YearTotalFull-timePart-time
TotalMenWomenTotalMenWomen
2015-16350955837255154101
2016-1731179384123213993
2017-1832397554222614581
2018-1929997593820213765
2019-2029482463621214666
2020-21273101564517211557
2021-2225081364516910960
2022-231715016341218437
2023-241403811271026438
Average268268423826812166
Lincoln Christian University Graduate Enrollment Trends Chart

Enrollment by Race/Ethnicity Changes

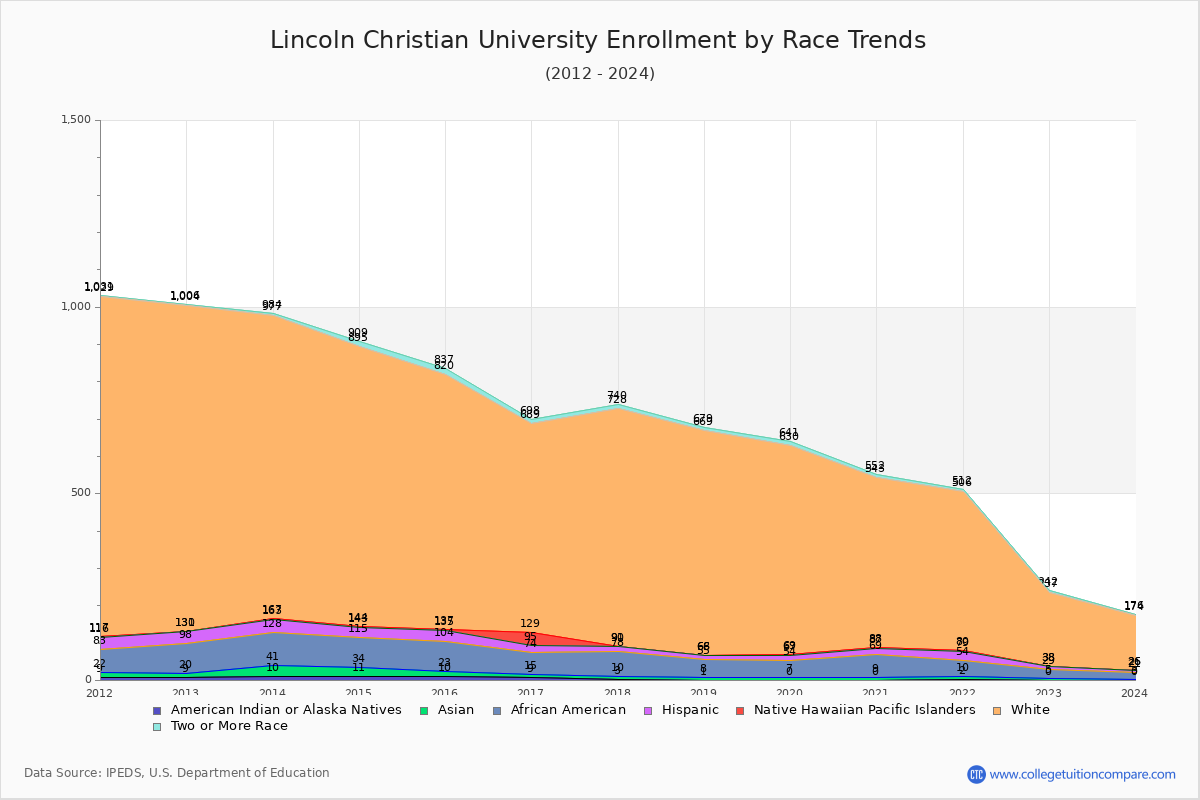
The percentage of white students is 80.00%. The percentage was 77.79% 10 years ago and Lincoln Christian still has a high percentage of white students. 1.62% of enrolled students is Asian and 9.73% is black students. Hispanic students comprise 2.70% of the student body.

Over the past 10 years, the racial composition has shifted. The percentage of white students increased from 77.79% to 80.00%. Asian enrollment grew from 1.48% to 1.62%. Black student enrollment increased from 9.23% to 9.73%. Hispanic student representation contracted from 3.53% to 2.70%.

The overall racial diversity, measured by the Census Bureau Diversity Index, is 0.3494 which indicates that somewhat diverse. This decreased from 0.3844 a decade ago, suggesting that racial diversity has declined.

The following table and chart illustrate the student population trends by race/ethnicity at Lincoln Christian University over the past 10 years (2015-2024).

YearAmerican Indian or Native AmericanAsianBlackHispanicNative Hawaiian or Other Pacific IslanderWhiteTwo or More Races
2015-1610138131268317
2016-17965921345609
2017-18376812163712
2018-19174711260110
2019-20074713256111
2020-2109601814559
2021-2228442514266
2022-230524901995
2023-240318501482
Average37501654749
Lincoln Christian University Enrollment by Race Trends Chart

Distance Learning (Online Courses) Enrollment Changes

72 students are enrolled in online degree programs exclusively for the academic year 2023-2024, which is 39% of total students. The number of online students has decreased -67.27% since 2015. The following table and chart illustrate the changes in the online student population by enrolled type at Lincoln Christian University from 2015 to 2024.

YearTotal EnrollmentOnline CompletelyEnrolled in Some Online CoursesNot Enrolled in Online Courses
2015-16878220302356
2016-17775200149426
2017-18789222111456
2018-19714216104394
2019-20672127162383
2020-21595121173301
2021-2253714292303
2022-23258958380
2023-24185724568
Average600157136307

Ratings & Review

Share your experiences and thoughts about Lincoln Christian University. It will be a great help to applicants and prospective students!