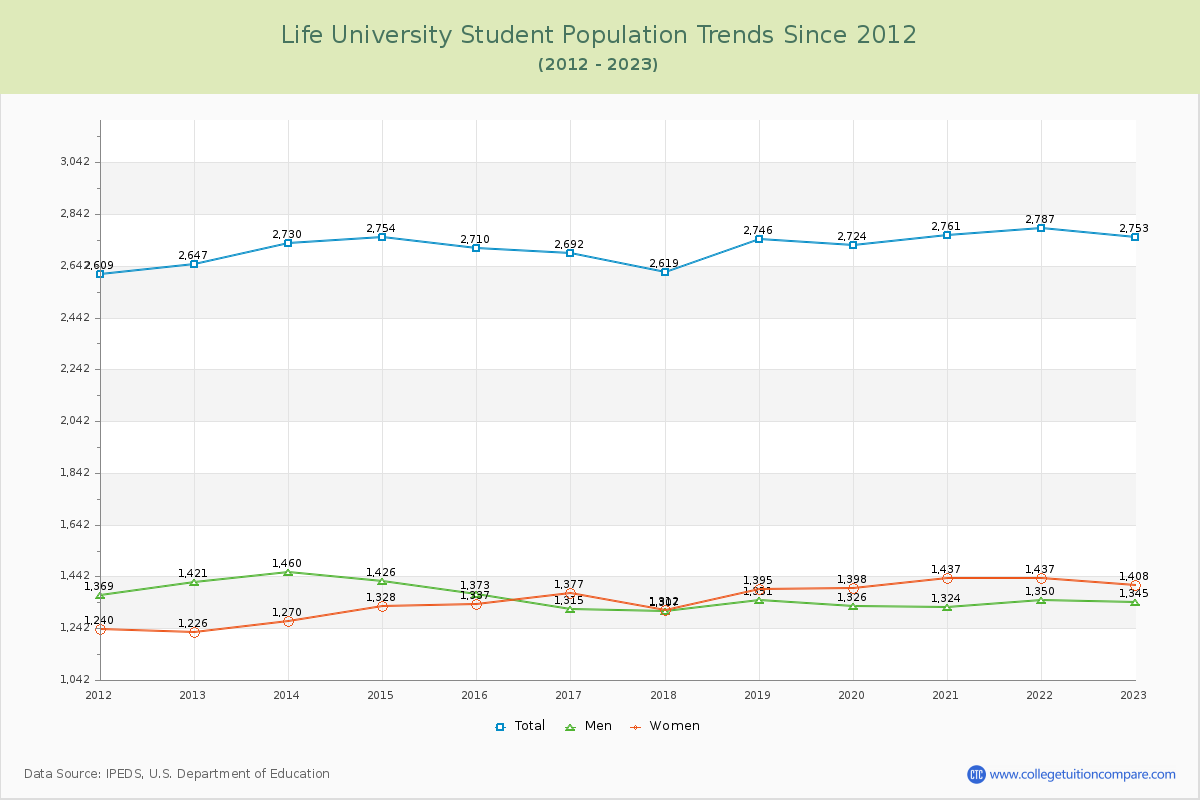
Student Population Changes
The average student population over the last 12 years is 2,720 where 2,753 students are attending the school for the academic year 2022-2023.
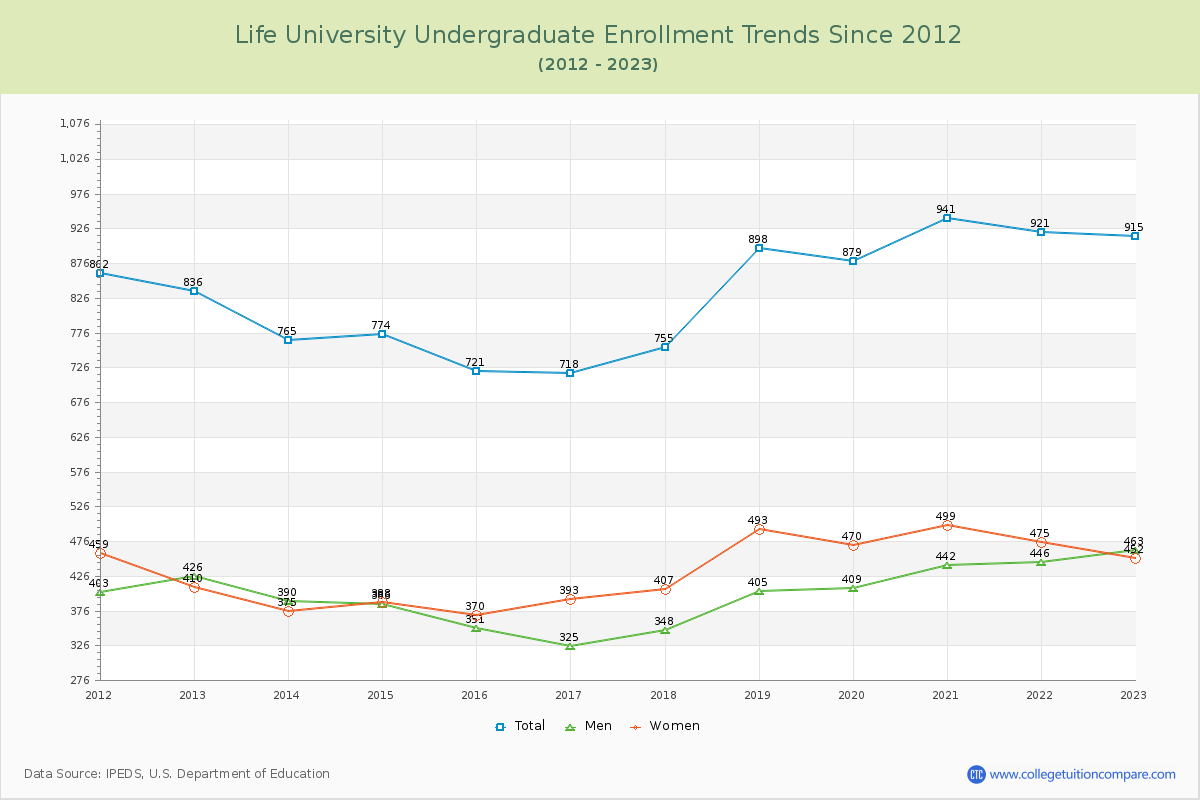
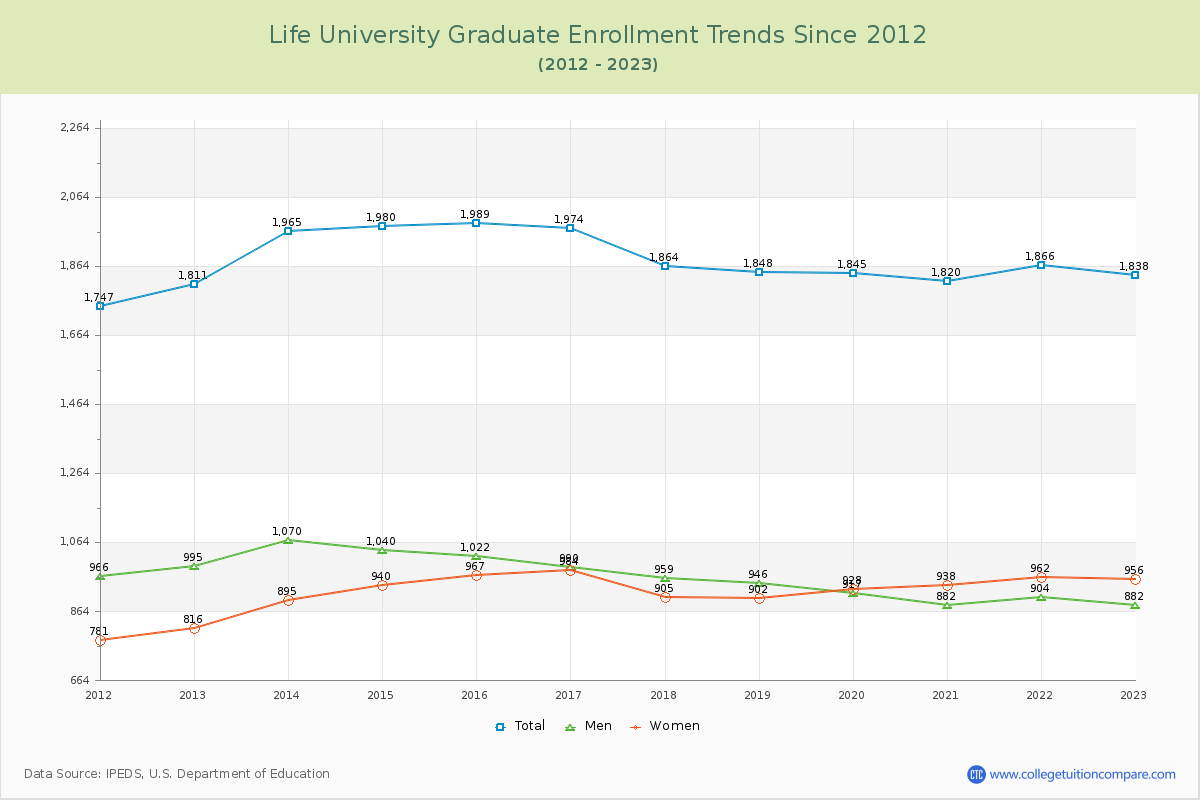
33.24% of total students is undergraduate students and 66.76% students is graduate students. The number of undergraduate students has increased by 79 and the graduate enrollment has increased by 27 over past 10 years.
The female to male ratio is 1.05 to 1 and it means that there are similar numbers of female and male students enrolled in Life.
The following table and chart illustrate the changes in student population by gender at Life University since 2012.
| Year | Total | Undergraduate | Graduate | ||||
|---|---|---|---|---|---|---|---|
| Total | Men | Women | Total | Men | Women | ||
| 2012-13 | 2,647 | 836 | 426 | 410 | 1,811 | 995 | 816 |
| 2013-14 | 2,730 83 | 765 -71 | 390 -36 | 375 -35 | 1,965 154 | 1,070 75 | 895 79 |
| 2014-15 | 2,754 24 | 774 9 | 386 -4 | 388 13 | 1,980 15 | 1,040 -30 | 940 45 |
| 2015-16 | 2,710 -44 | 721 -53 | 351 -35 | 370 -18 | 1,989 9 | 1,022 -18 | 967 27 |
| 2016-17 | 2,692 -18 | 718 -3 | 325 -26 | 393 23 | 1,974 -15 | 990 -32 | 984 17 |
| 2017-18 | 2,619 -73 | 755 37 | 348 23 | 407 14 | 1,864 -110 | 959 -31 | 905 -79 |
| 2018-19 | 2,746 127 | 898 143 | 405 57 | 493 86 | 1,848 -16 | 946 -13 | 902 -3 |
| 2019-20 | 2,724 -22 | 879 -19 | 409 4 | 470 -23 | 1,845 -3 | 917 -29 | 928 26 |
| 2020-21 | 2,761 37 | 941 62 | 442 33 | 499 29 | 1,820 -25 | 882 -35 | 938 10 |
| 2021-22 | 2,787 26 | 921 -20 | 446 4 | 475 -24 | 1,866 46 | 904 22 | 962 24 |
| 2022-23 | 2,753 -34 | 915 -6 | 463 17 | 452 -23 | 1,838 -28 | 882 -22 | 956 -6 |
| Average | 2,720 | 829 | 399 | 430 | 1,891 | 964 | 927 |