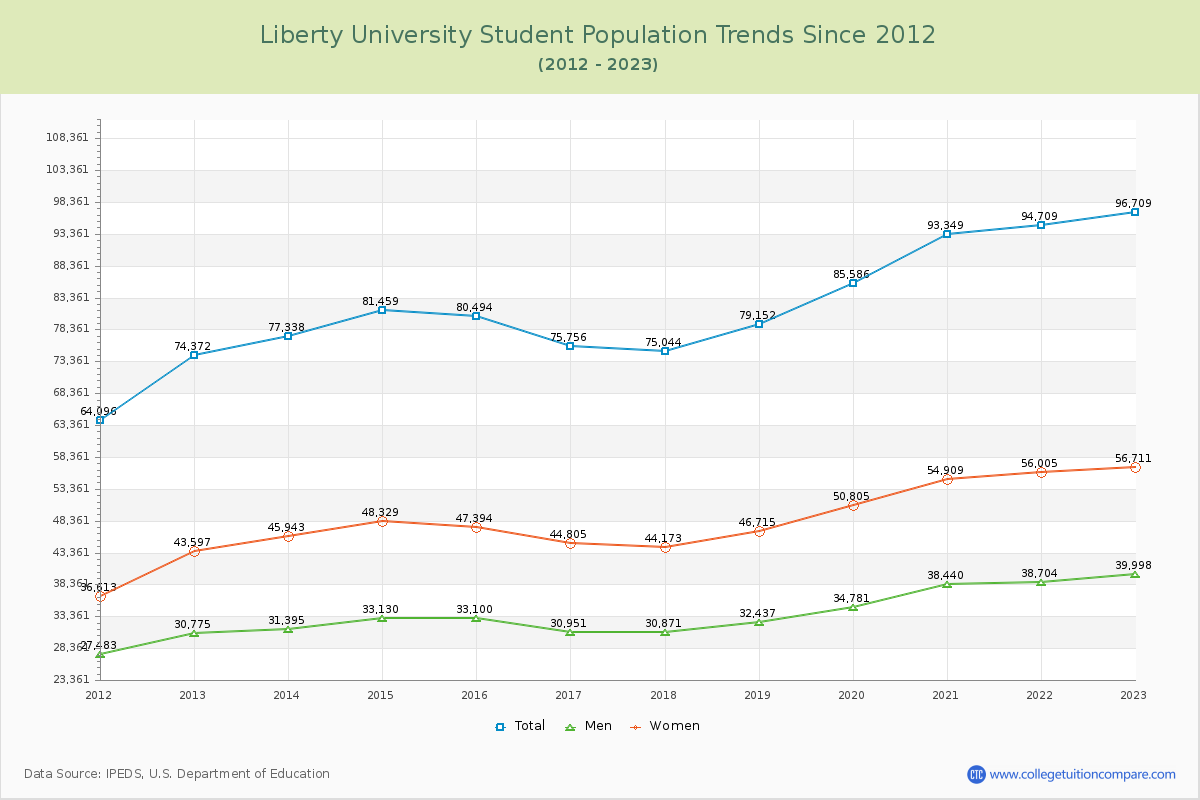
Student Population Changes
The average student population over the last 12 years is 83,088 where 96,709 students are attending the school for the academic year 2022-2023.
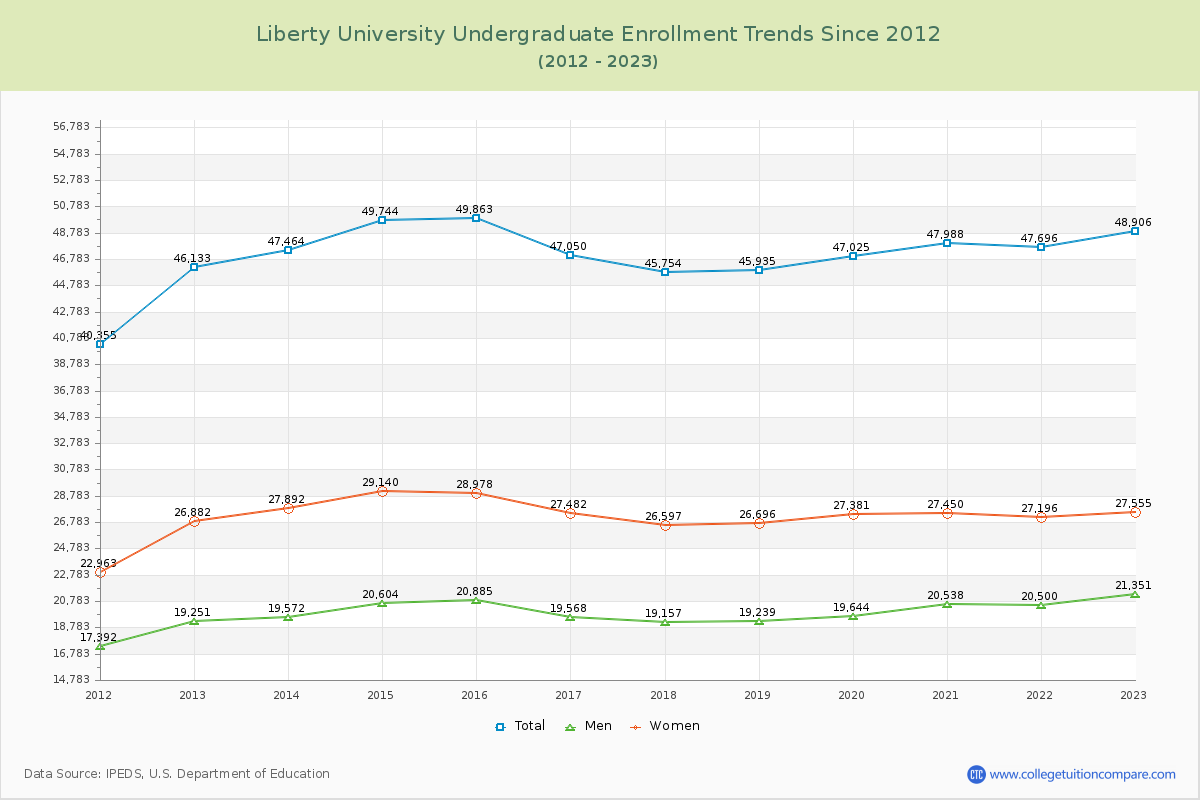
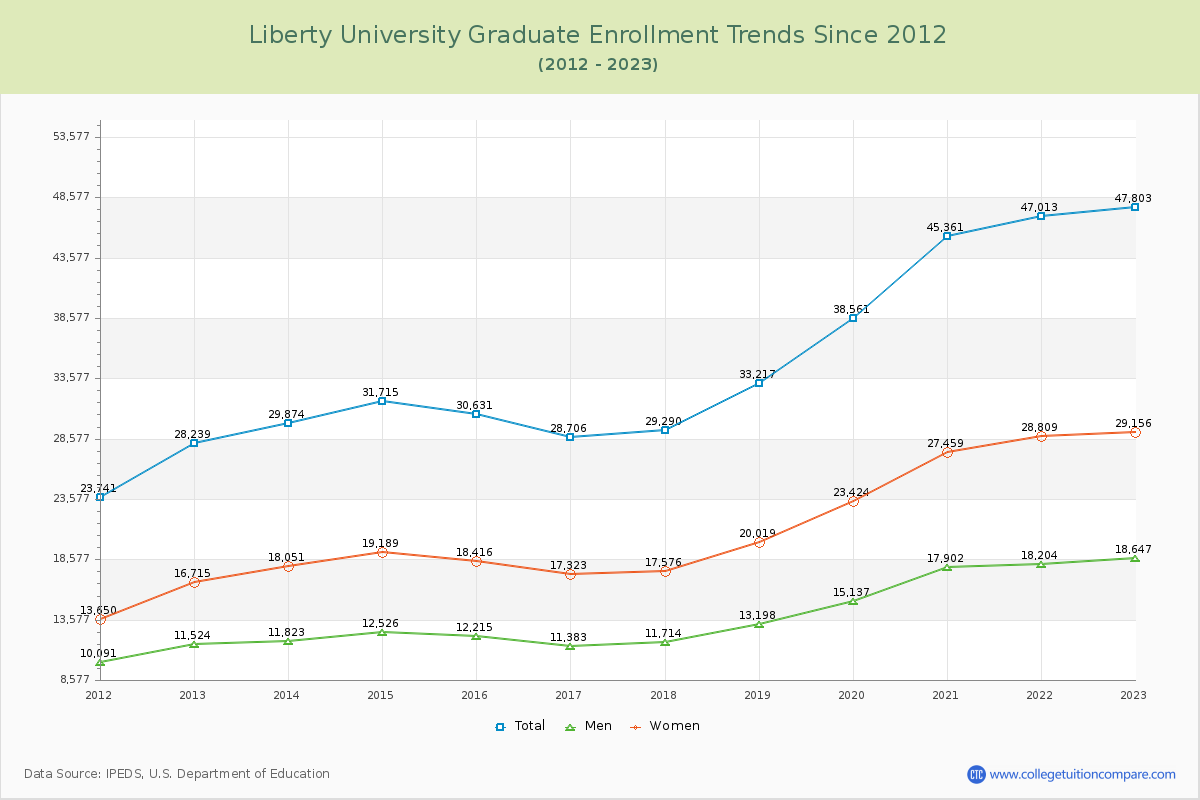
50.57% of total students is undergraduate students and 49.43% students is graduate students. The number of undergraduate students has increased by 2,773 and the graduate enrollment has increased by 19,564 over past 10 years.
The female to male ratio is 1.42 to 1 and it means that there are more female students enrolled in Liberty than male students.
The following table and chart illustrate the changes in student population by gender at Liberty University since 2012.
| Year | Total | Undergraduate | Graduate | ||||
|---|---|---|---|---|---|---|---|
| Total | Men | Women | Total | Men | Women | ||
| 2012-13 | 74,372 | 46,133 | 19,251 | 26,882 | 28,239 | 11,524 | 16,715 |
| 2013-14 | 77,338 2,966 | 47,464 1,331 | 19,572 321 | 27,892 1,010 | 29,874 1,635 | 11,823 299 | 18,051 1,336 |
| 2014-15 | 81,459 4,121 | 49,744 2,280 | 20,604 1,032 | 29,140 1,248 | 31,715 1,841 | 12,526 703 | 19,189 1,138 |
| 2015-16 | 80,494 -965 | 49,863 119 | 20,885 281 | 28,978 -162 | 30,631 -1,084 | 12,215 -311 | 18,416 -773 |
| 2016-17 | 75,756 -4,738 | 47,050 -2,813 | 19,568 -1,317 | 27,482 -1,496 | 28,706 -1,925 | 11,383 -832 | 17,323 -1,093 |
| 2017-18 | 75,044 -712 | 45,754 -1,296 | 19,157 -411 | 26,597 -885 | 29,290 584 | 11,714 331 | 17,576 253 |
| 2018-19 | 79,152 4,108 | 45,935 181 | 19,239 82 | 26,696 99 | 33,217 3,927 | 13,198 1,484 | 20,019 2,443 |
| 2019-20 | 85,586 6,434 | 47,025 1,090 | 19,644 405 | 27,381 685 | 38,561 5,344 | 15,137 1,939 | 23,424 3,405 |
| 2020-21 | 93,349 7,763 | 47,988 963 | 20,538 894 | 27,450 69 | 45,361 6,800 | 17,902 2,765 | 27,459 4,035 |
| 2021-22 | 94,709 1,360 | 47,696 -292 | 20,500 -38 | 27,196 -254 | 47,013 1,652 | 18,204 302 | 28,809 1,350 |
| 2022-23 | 96,709 2,000 | 48,906 1,210 | 21,351 851 | 27,555 359 | 47,803 790 | 18,647 443 | 29,156 347 |
| Average | 83,088 | 47,596 | 20,028 | 27,568 | 35,492 | 14,025 | 21,467 |