Enrollment Trends at Lewis & Clark

-22

Total Enrollment

-159

Men

137

Women

The student population at Lewis & Clark College is 3,504 (2,139 undergraduate and 1,365 graduate students) . The number of students has decreased by 22 over the past decade.

The percentage of undergraduate students at Lewis & Clark is 61.04% which is decreased by 70 over last 10 years. The graduate student population increased by 48 and it has been increasing.

The female to male ratio is 1.99 to 1 which means that female students enrolled more than male students.

144 students enrolled in online degree program exclusively and the number of online students has increased by 476.00% since 2015.

Student Population Changes

The average student population over the last 11 years is 3,418 where 3,504 students are attending the school for the academic year 2024-2025.

61.04% of total students is undergraduate students and 38.96% students is graduate students. The number of undergraduate students has decreased by 70 and the graduate enrollment has increased by 48 over past 10 years.

The female to male ratio is 1.99 to 1 and it means that there are more female students enrolled in Lewis & Clark than male students.

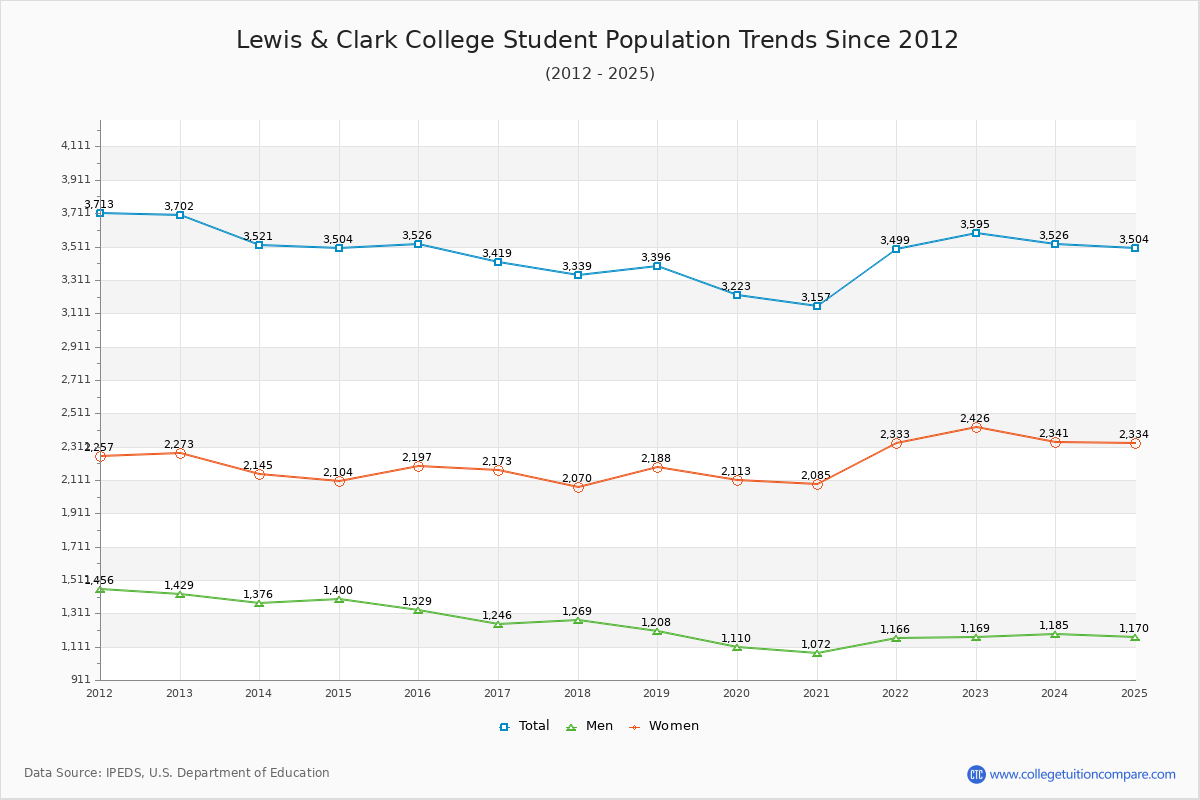
The following table and chart illustrate the changes in student population by gender at Lewis & Clark College since 2015.

YearTotalUndergraduateGraduate
TotalMenWomenTotalMenWomen
2015-163,5262,2098671,3421,317462855
2016-173,419
-107
2,134
-75
823
-44
1,311
-31
1,285
-32
423
-39
862
7
2017-183,339
-80
2,106
-28
883
60
1,223
-88
1,233
-52
386
-37
847
-15
2018-193,396
57
2,087
-19
824
-59
1,263
40
1,309
76
384
-2
925
78
2019-203,223
-173
1,935
-152
753
-71
1,182
-81
1,288
-21
357
-27
931
6
2020-213,157
-66
1,830
-105
689
-64
1,141
-41
1,327
39
383
26
944
13
2021-223,499
342
2,116
286
769
80
1,347
206
1,383
56
397
14
986
42
2022-233,595
96
2,204
88
783
14
1,421
74
1,391
8
386
-11
1,005
19
2023-243,526
-69
2,194
-10
807
24
1,387
-34
1,332
-59
378
-8
954
-51
2024-253,504
-22
2,139
-55
796
-11
1,343
-44
1,365
33
374
-4
991
37
Average3,4182,0957991,2961,323393930
Lewis & Clark College Enrollment Trends Chart

Undergraduate Enrollment Changes

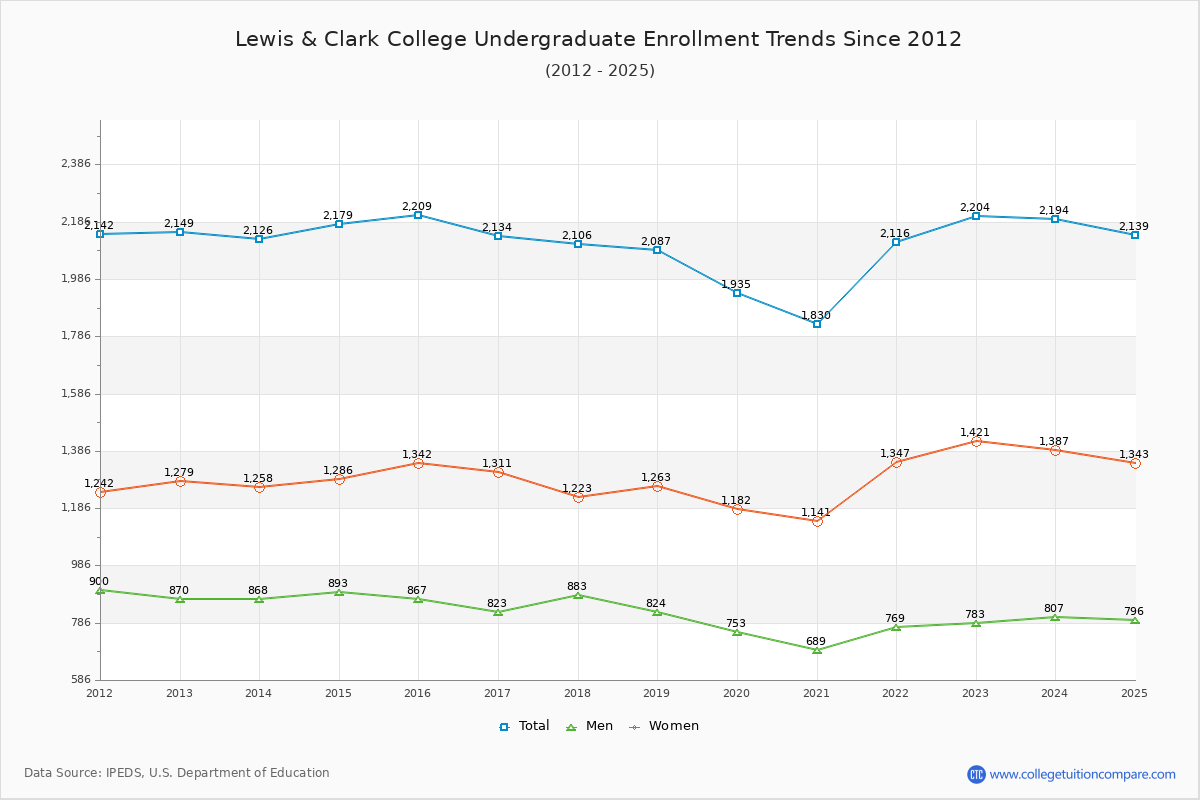
The average number of Undergraduate students over the last 11 years is 2,095 where 2,139 students are attending the Undergraduate school for the academic year 2024-2025. The following table and chart illustrate the changes in Undergraduate enrollment by attending status and gender at Lewis & Clark College since 2015.

YearTotalFull-timePart-time
TotalMenWomenTotalMenWomen
2015-162,2092,1778521,325321517
2016-172,1342,1028081,294321517
2017-182,1062,0678631,204392019
2018-192,0872,0588091,249291514
2019-201,9351,9047371,167311615
2020-211,8301,8126841,12818513
2021-222,1162,0977571,34019127
2022-232,2042,1817711,410231211
2023-242,1942,1647891,375301812
2024-252,1392,0957681,327442816
Average2,0952,0957841,2822,0951614
Lewis & Clark College Undergraduate Enrollment Trends Chart

Graduate Enrollment Changes

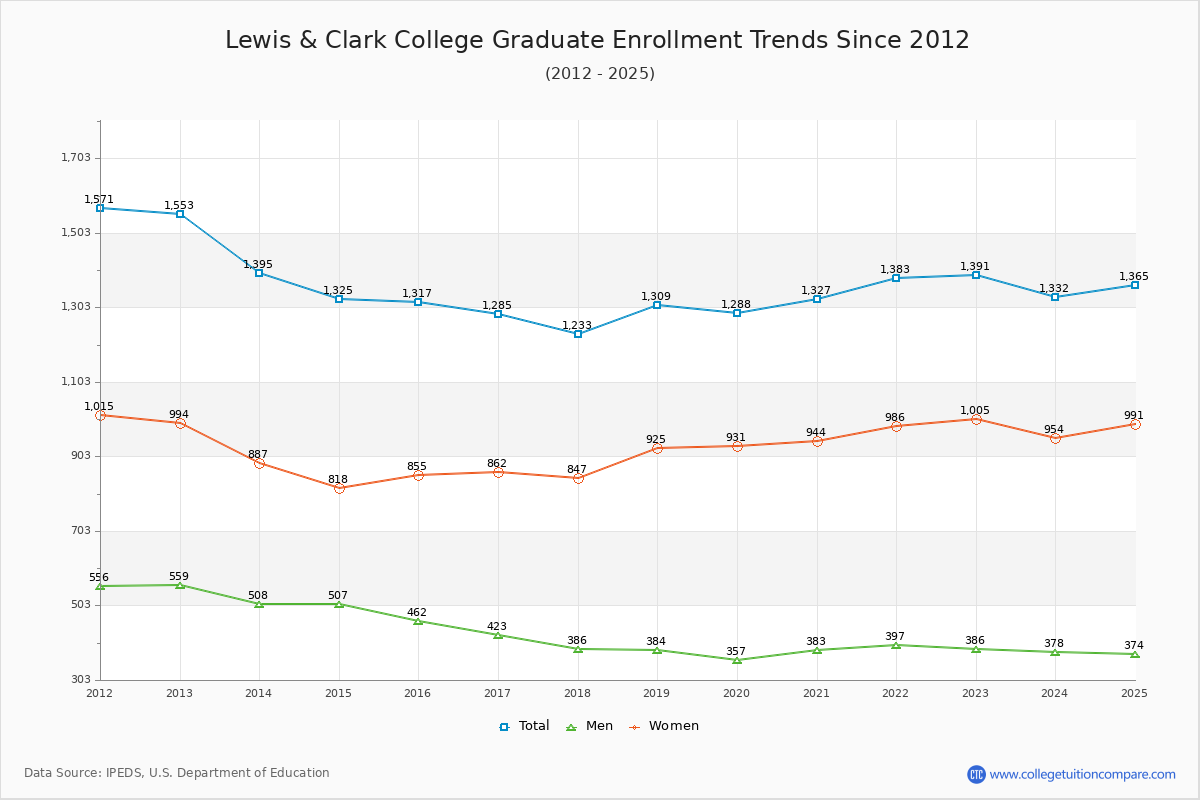
The average number of Graduate students over the last 11 years is 1,323 where 1,365 students are attending the Graduate school for the academic year 2024-2025. The following table and chart illustrate the changes in Graduate enrollment by attending status and gender at Lewis & Clark College since 2015.

YearTotalFull-timePart-time
TotalMenWomenTotalMenWomen
2015-161,31799037861232784243
2016-171,28591432758737196275
2017-181,23387528958635897261
2018-191,309881261620428123305
2019-201,28890427063438487297
2020-211,327900273627427110317
2021-221,383949281668434116318
2022-231,3911,02829173736395268
2023-241,33298328170234997252
2024-251,365936262674429112317
Average1,3231,3232916451,323102285
Lewis & Clark College Graduate Enrollment Trends Chart

Enrollment by Race/Ethnicity Changes

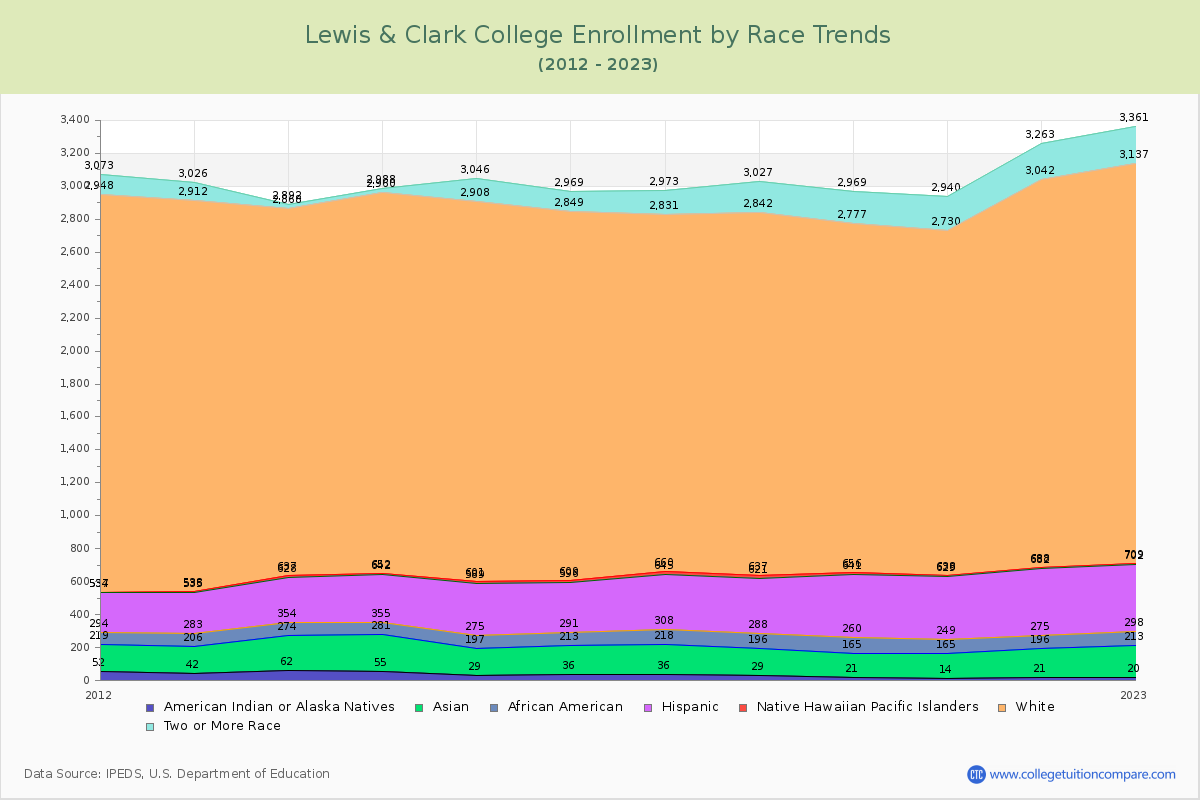
The percentage of white students is 61.39%. The percentage was 65.43% 10 years ago and Lewis & Clark still has a high percentage of white students. 4.62% of enrolled students is Asian and 2.65% is black students. Hispanic students comprise 12.01% of the student body.

Over the past 10 years, the racial composition has shifted. The percentage of white students decreased from 65.43% to 61.39%. Asian enrollment declined from 4.76% to 4.62%. Black student enrollment increased from 2.21% to 2.65%. Hispanic student representation expanded from 8.91% to 12.01%.

The overall racial diversity, measured by the Census Bureau Diversity Index, is 0.6013 which indicates that moderately diverse. This increased from 0.5596 a decade ago, suggesting that racial diversity has improved.

The following table and chart illustrate the student population trends by race/ethnicity at Lewis & Clark College over the past 11 years (2015-2025).

YearAmerican Indian or Native AmericanAsianBlackHispanicNative Hawaiian or Other Pacific IslanderWhiteTwo or More Races
2015-162916878314122,307138
2016-173617778305132,240120
2017-183618290337152,171142
2018-192916792333162,205185
2019-202114495381152,121192
2020-21141518438092,092210
2021-22211757940762,354221
2022-23201938540472,428224
2023-2481769042492,328241
2024-25111629342172,151237
Average2317086371112,240191
Lewis & Clark College Enrollment by Race Trends Chart

Distance Learning (Online Courses) Enrollment Changes

144 students are enrolled in online degree programs exclusively for the academic year 2024-2025, which is 4% of total students. The number of online students has increased 476.00% since 2015. The following table and chart illustrate the changes in the online student population by enrolled type at Lewis & Clark College from 2015 to 2025.

YearTotal EnrollmentOnline CompletelyEnrolled in Some Online CoursesNot Enrolled in Online Courses
2015-163,5262513,500
2016-173,419003,419
2017-183,339403,335
2018-193,396803,388
2019-203,22314673,142
2020-213,1578701,999288
2021-223,499824962,921
2022-233,5951163263,153
2023-243,5261023523,072
2024-253,5041443073,053
Average3,4181373552,927

Ratings & Review

Share your experiences and thoughts about Lewis & Clark College. It will be a great help to applicants and prospective students!