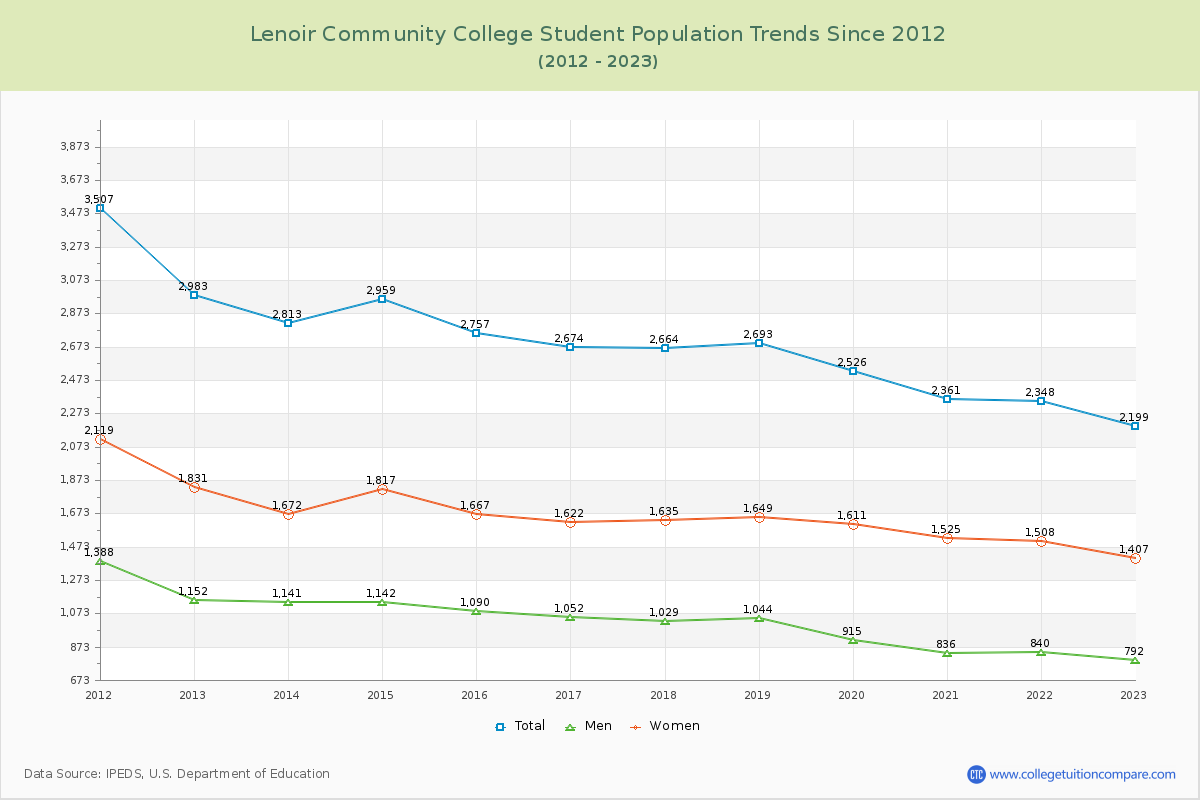
Student Population Changes
The average student population over the last 12 years is 2,634 where 2,199 students are attending the school for the academic year 2022-2023.
The female to male ratio is 1.78 to 1 and it means that there are more female students enrolled in Lenoir CC than male students.
The following table and chart illustrate the changes in student population by gender at Lenoir Community College since 2012.
| Year | Total | Men | Women |
|---|---|---|---|
| 2012-13 | 2,983 | 1,152 | 1,831 |
| 2013-14 | 2,813 -170 | 1,141 -11 | 1,672 -159 |
| 2014-15 | 2,959 146 | 1,142 1 | 1,817 145 |
| 2015-16 | 2,757 -202 | 1,090 -52 | 1,667 -150 |
| 2016-17 | 2,674 -83 | 1,052 -38 | 1,622 -45 |
| 2017-18 | 2,664 -10 | 1,029 -23 | 1,635 13 |
| 2018-19 | 2,693 29 | 1,044 15 | 1,649 14 |
| 2019-20 | 2,526 -167 | 915 -129 | 1,611 -38 |
| 2020-21 | 2,361 -165 | 836 -79 | 1,525 -86 |
| 2021-22 | 2,348 -13 | 840 4 | 1,508 -17 |
| 2022-23 | 2,199 -149 | 792 -48 | 1,407 -101 |
| Average | 2,634 | 1,003 | 1,631 |