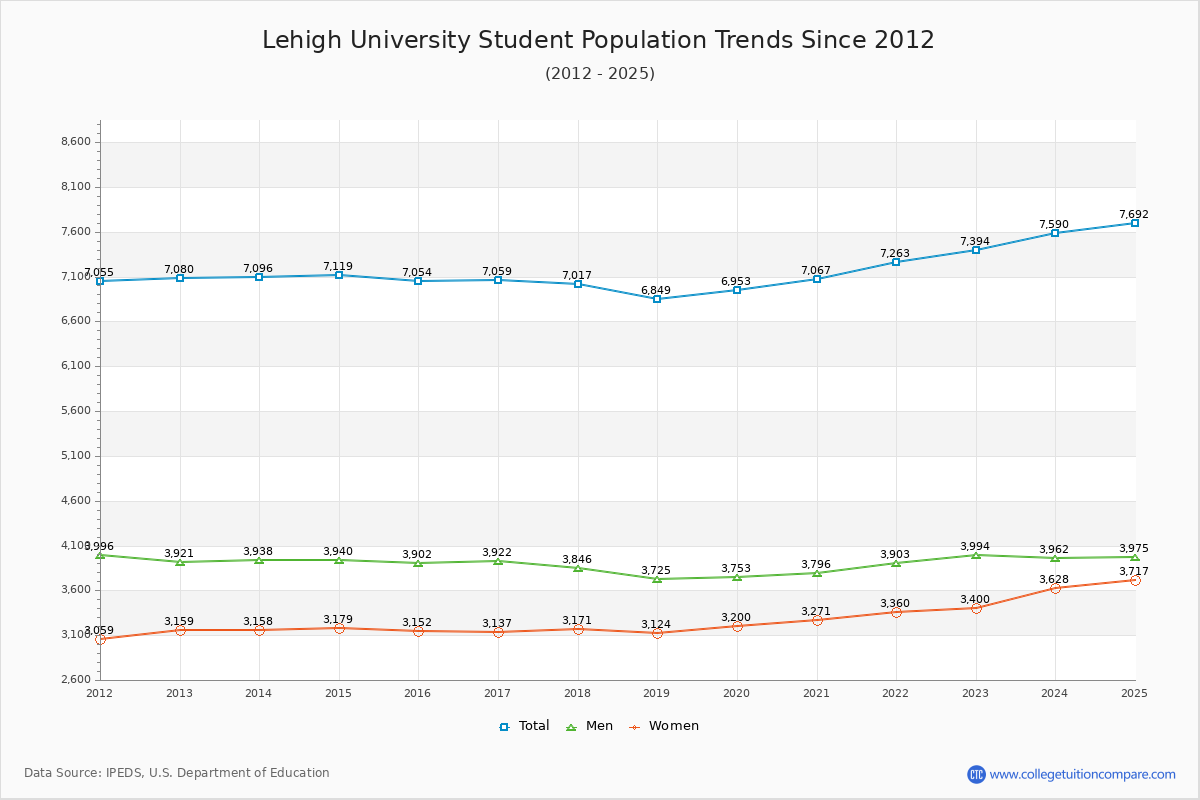
Student Population Changes
The average student population over the last 12 years is 7,086 where 7,394 students are attending the school for the academic year 2022-2023.
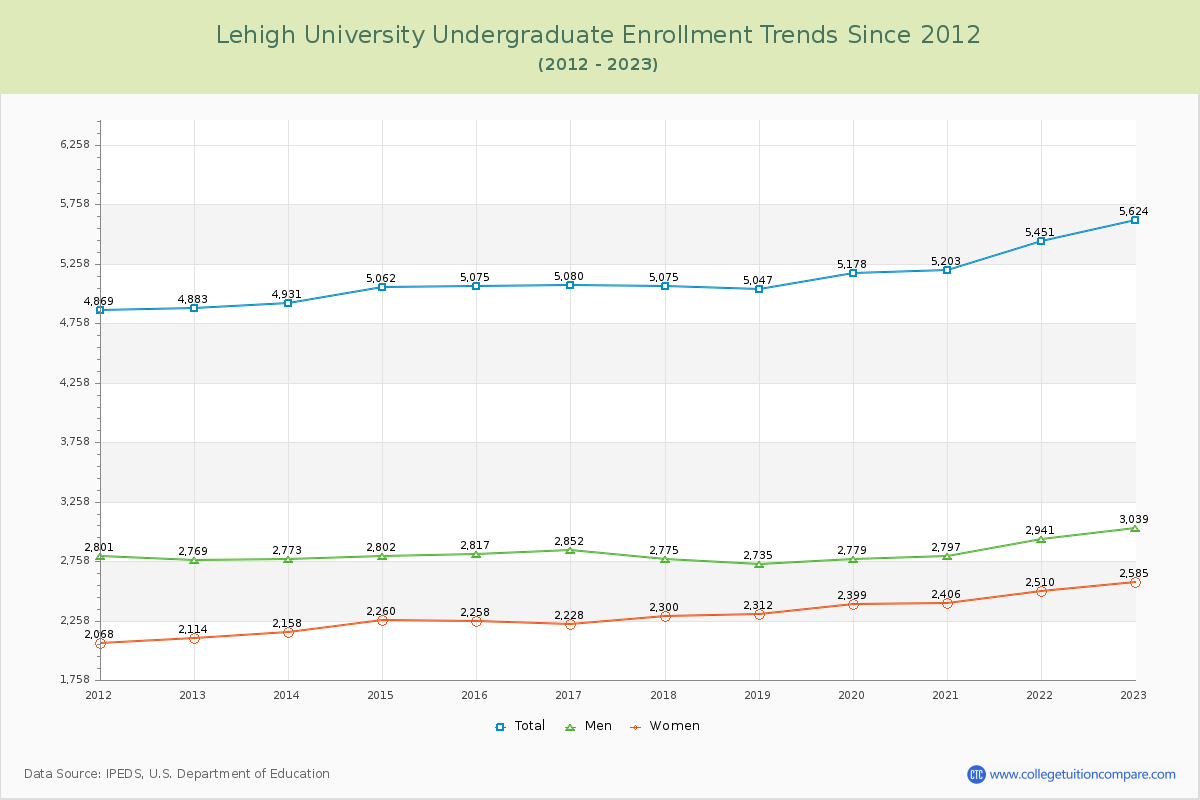
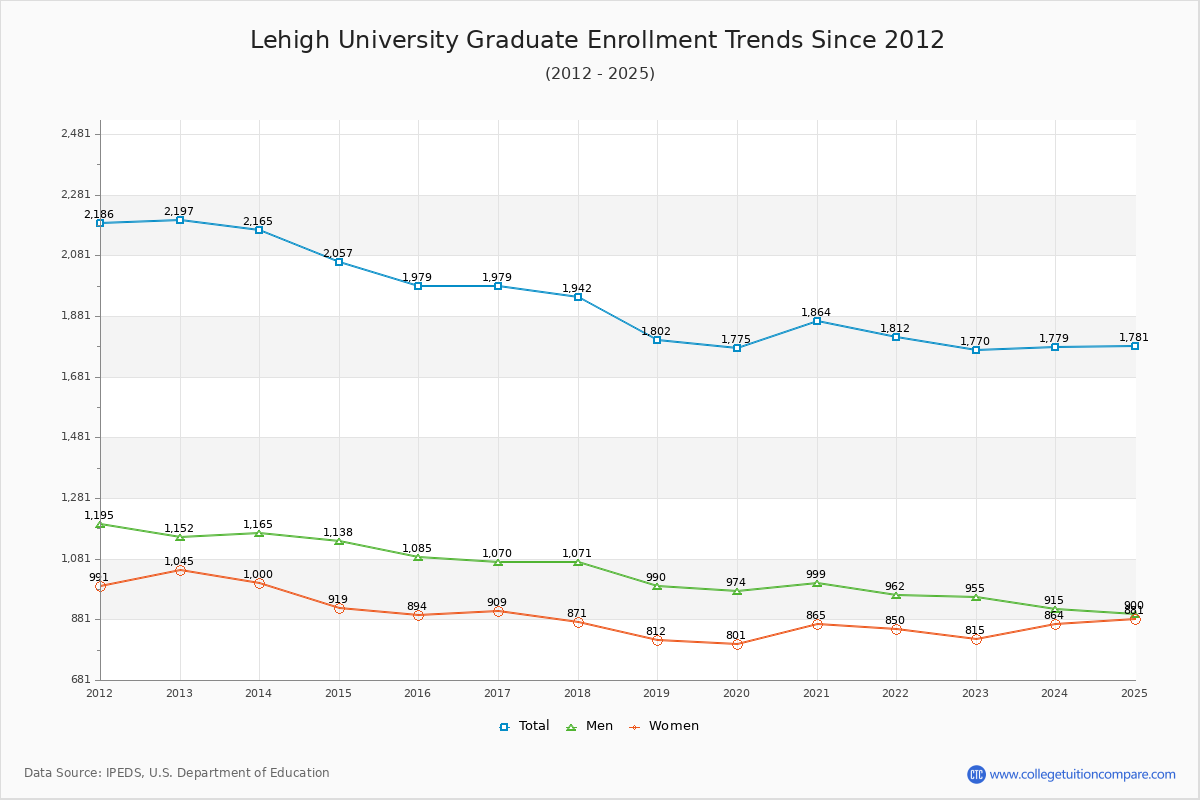
76.06% of total students is undergraduate students and 23.94% students is graduate students. The number of undergraduate students has increased by 741 and the graduate enrollment has decreased by 427 over past 10 years.
The female to male ratio is 0.85 to 1 and it means that there are slightly more male students enrolled in Lehigh than female students.
The following table and chart illustrate the changes in student population by gender at Lehigh University since 2012.
| Year | Total | Undergraduate | Graduate | ||||
|---|---|---|---|---|---|---|---|
| Total | Men | Women | Total | Men | Women | ||
| 2012-13 | 7,080 | 4,883 | 2,769 | 2,114 | 2,197 | 1,152 | 1,045 |
| 2013-14 | 7,096 16 | 4,931 48 | 2,773 4 | 2,158 44 | 2,165 -32 | 1,165 13 | 1,000 -45 |
| 2014-15 | 7,119 23 | 5,062 131 | 2,802 29 | 2,260 102 | 2,057 -108 | 1,138 -27 | 919 -81 |
| 2015-16 | 7,054 -65 | 5,075 13 | 2,817 15 | 2,258 -2 | 1,979 -78 | 1,085 -53 | 894 -25 |
| 2016-17 | 7,059 5 | 5,080 5 | 2,852 35 | 2,228 -30 | 1,979 0 | 1,070 -15 | 909 15 |
| 2017-18 | 7,017 -42 | 5,075 -5 | 2,775 -77 | 2,300 72 | 1,942 -37 | 1,071 1 | 871 -38 |
| 2018-19 | 6,849 -168 | 5,047 -28 | 2,735 -40 | 2,312 12 | 1,802 -140 | 990 -81 | 812 -59 |
| 2019-20 | 6,953 104 | 5,178 131 | 2,779 44 | 2,399 87 | 1,775 -27 | 974 -16 | 801 -11 |
| 2020-21 | 7,067 114 | 5,203 25 | 2,797 18 | 2,406 7 | 1,864 89 | 999 25 | 865 64 |
| 2021-22 | 7,263 196 | 5,451 248 | 2,941 144 | 2,510 104 | 1,812 -52 | 962 -37 | 850 -15 |
| 2022-23 | 7,394 131 | 5,624 173 | 3,039 98 | 2,585 75 | 1,770 -42 | 955 -7 | 815 -35 |
| Average | 7,086 | 5,146 | 2,825 | 2,321 | 1,940 | 1,051 | 889 |