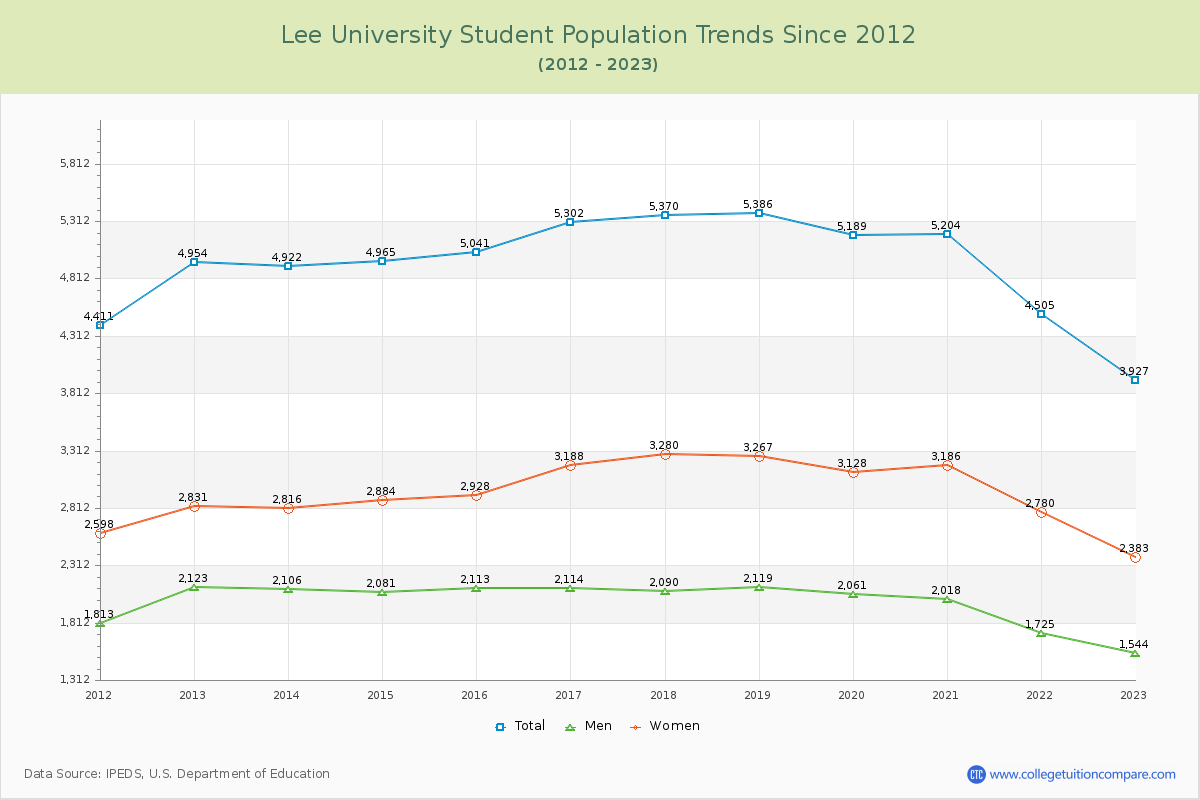
Student Population Changes
The average student population over the last 12 years is 4,979 where 3,927 students are attending the school for the academic year 2022-2023.
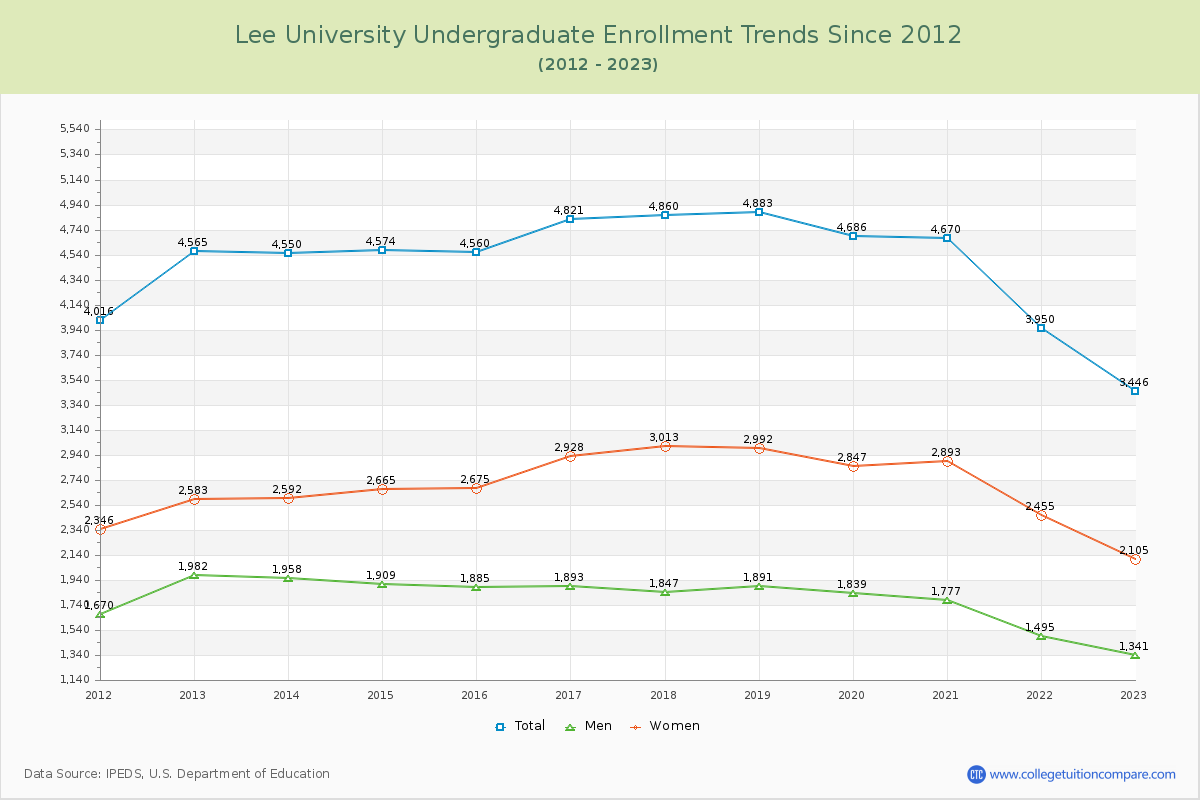
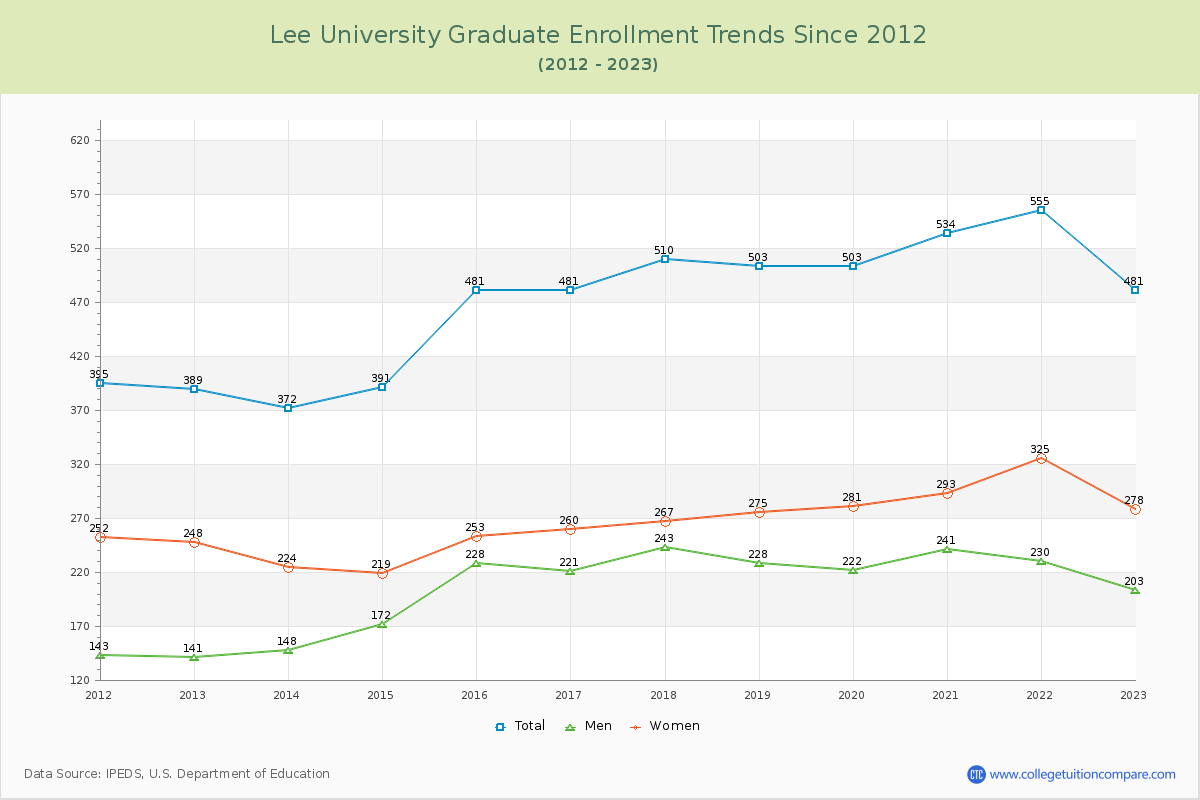
87.75% of total students is undergraduate students and 12.25% students is graduate students. The number of undergraduate students has decreased by 1,119 and the graduate enrollment has increased by 92 over past 10 years.
The female to male ratio is 1.54 to 1 and it means that there are more female students enrolled in Lee than male students.
The following table and chart illustrate the changes in student population by gender at Lee University since 2012.
| Year | Total | Undergraduate | Graduate | ||||
|---|---|---|---|---|---|---|---|
| Total | Men | Women | Total | Men | Women | ||
| 2012-13 | 4,954 | 4,565 | 1,982 | 2,583 | 389 | 141 | 248 |
| 2013-14 | 4,922 -32 | 4,550 -15 | 1,958 -24 | 2,592 9 | 372 -17 | 148 7 | 224 -24 |
| 2014-15 | 4,965 43 | 4,574 24 | 1,909 -49 | 2,665 73 | 391 19 | 172 24 | 219 -5 |
| 2015-16 | 5,041 76 | 4,560 -14 | 1,885 -24 | 2,675 10 | 481 90 | 228 56 | 253 34 |
| 2016-17 | 5,302 261 | 4,821 261 | 1,893 8 | 2,928 253 | 481 0 | 221 -7 | 260 7 |
| 2017-18 | 5,370 68 | 4,860 39 | 1,847 -46 | 3,013 85 | 510 29 | 243 22 | 267 7 |
| 2018-19 | 5,386 16 | 4,883 23 | 1,891 44 | 2,992 -21 | 503 -7 | 228 -15 | 275 8 |
| 2019-20 | 5,189 -197 | 4,686 -197 | 1,839 -52 | 2,847 -145 | 503 0 | 222 -6 | 281 6 |
| 2020-21 | 5,204 15 | 4,670 -16 | 1,777 -62 | 2,893 46 | 534 31 | 241 19 | 293 12 |
| 2021-22 | 4,505 -699 | 3,950 -720 | 1,495 -282 | 2,455 -438 | 555 21 | 230 -11 | 325 32 |
| 2022-23 | 3,927 -578 | 3,446 -504 | 1,341 -154 | 2,105 -350 | 481 -74 | 203 -27 | 278 -47 |
| Average | 4,979 | 4,506 | 1,802 | 2,704 | 473 | 207 | 266 |