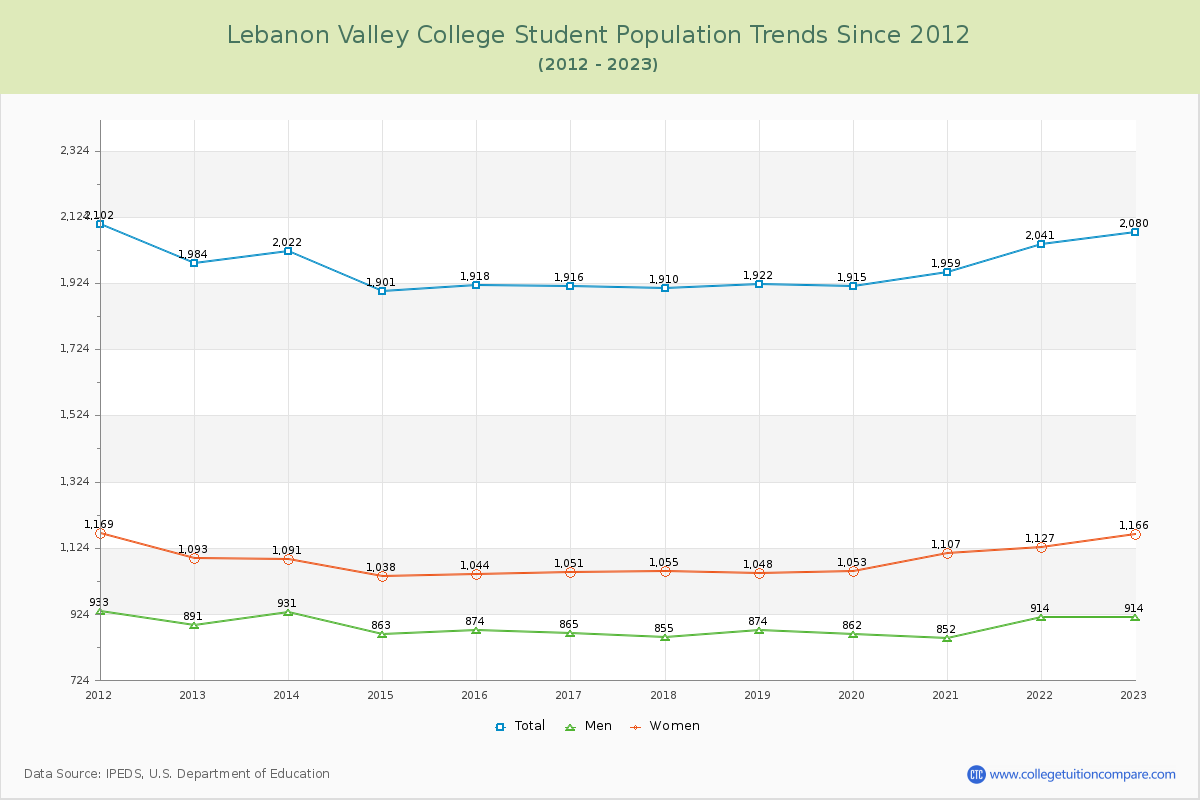
Student Population Changes
The average student population over the last 12 years is 1,961 where 2,080 students are attending the school for the academic year 2022-2023.
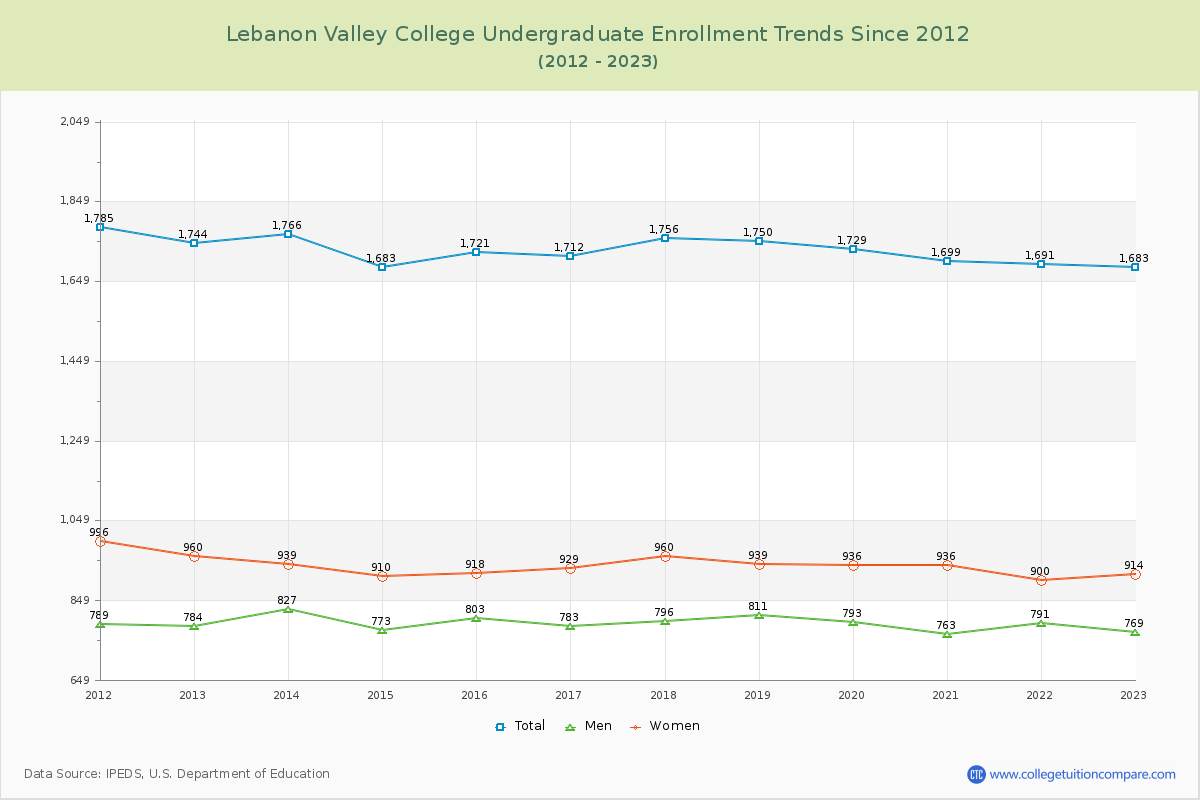
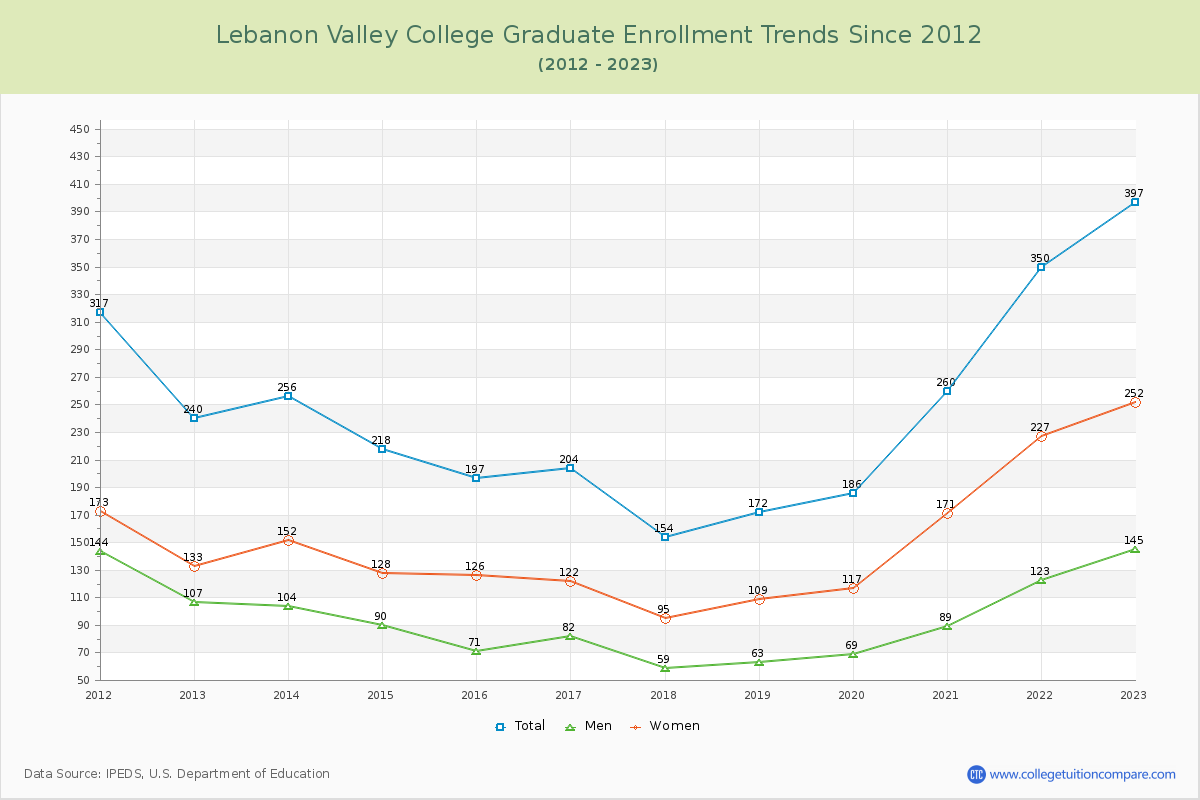
80.91% of total students is undergraduate students and 19.09% students is graduate students. The number of undergraduate students has decreased by 61 and the graduate enrollment has increased by 157 over past 10 years.
The female to male ratio is 1.28 to 1 and it means that there are slightly more female students enrolled in LVC than male students.
The following table and chart illustrate the changes in student population by gender at Lebanon Valley College since 2012.
| Year | Total | Undergraduate | Graduate | ||||
|---|---|---|---|---|---|---|---|
| Total | Men | Women | Total | Men | Women | ||
| 2012-13 | 1,984 | 1,744 | 784 | 960 | 240 | 107 | 133 |
| 2013-14 | 2,022 38 | 1,766 22 | 827 43 | 939 -21 | 256 16 | 104 -3 | 152 19 |
| 2014-15 | 1,901 -121 | 1,683 -83 | 773 -54 | 910 -29 | 218 -38 | 90 -14 | 128 -24 |
| 2015-16 | 1,918 17 | 1,721 38 | 803 30 | 918 8 | 197 -21 | 71 -19 | 126 -2 |
| 2016-17 | 1,916 -2 | 1,712 -9 | 783 -20 | 929 11 | 204 7 | 82 11 | 122 -4 |
| 2017-18 | 1,910 -6 | 1,756 44 | 796 13 | 960 31 | 154 -50 | 59 -23 | 95 -27 |
| 2018-19 | 1,922 12 | 1,750 -6 | 811 15 | 939 -21 | 172 18 | 63 4 | 109 14 |
| 2019-20 | 1,915 -7 | 1,729 -21 | 793 -18 | 936 -3 | 186 14 | 69 6 | 117 8 |
| 2020-21 | 1,959 44 | 1,699 -30 | 763 -30 | 936 0 | 260 74 | 89 20 | 171 54 |
| 2021-22 | 2,041 82 | 1,691 -8 | 791 28 | 900 -36 | 350 90 | 123 34 | 227 56 |
| 2022-23 | 2,080 39 | 1,683 -8 | 769 -22 | 914 14 | 397 47 | 145 22 | 252 25 |
| Average | 1,961 | 1,721 | 790 | 931 | 239 | 91 | 148 |