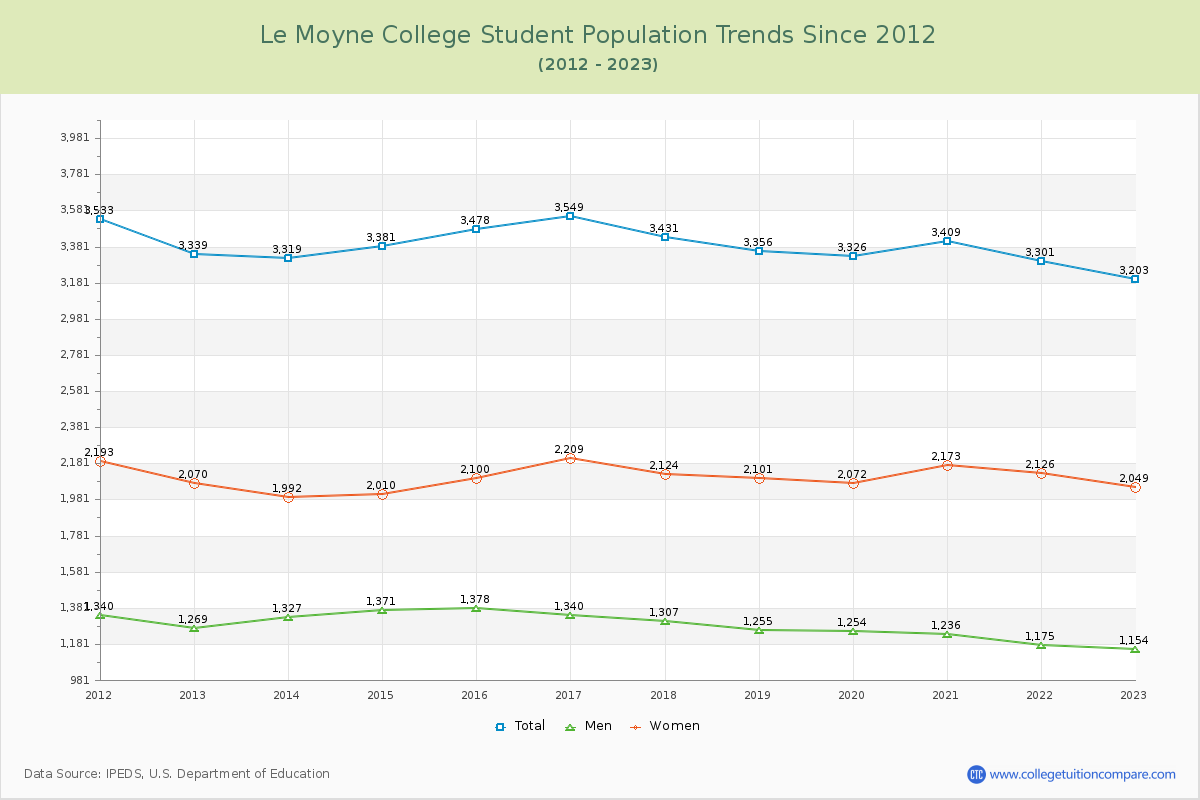
Student Population Changes
The average student population over the last 12 years is 3,372 where 3,203 students are attending the school for the academic year 2022-2023.
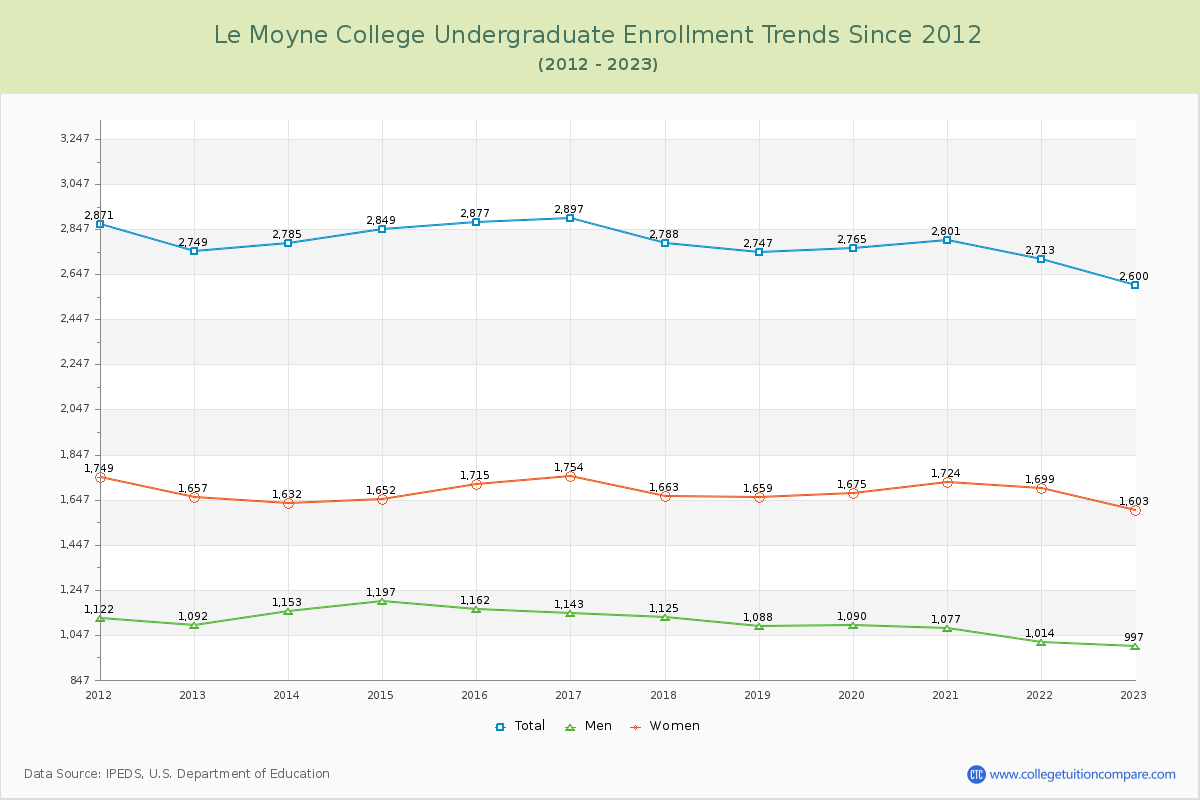
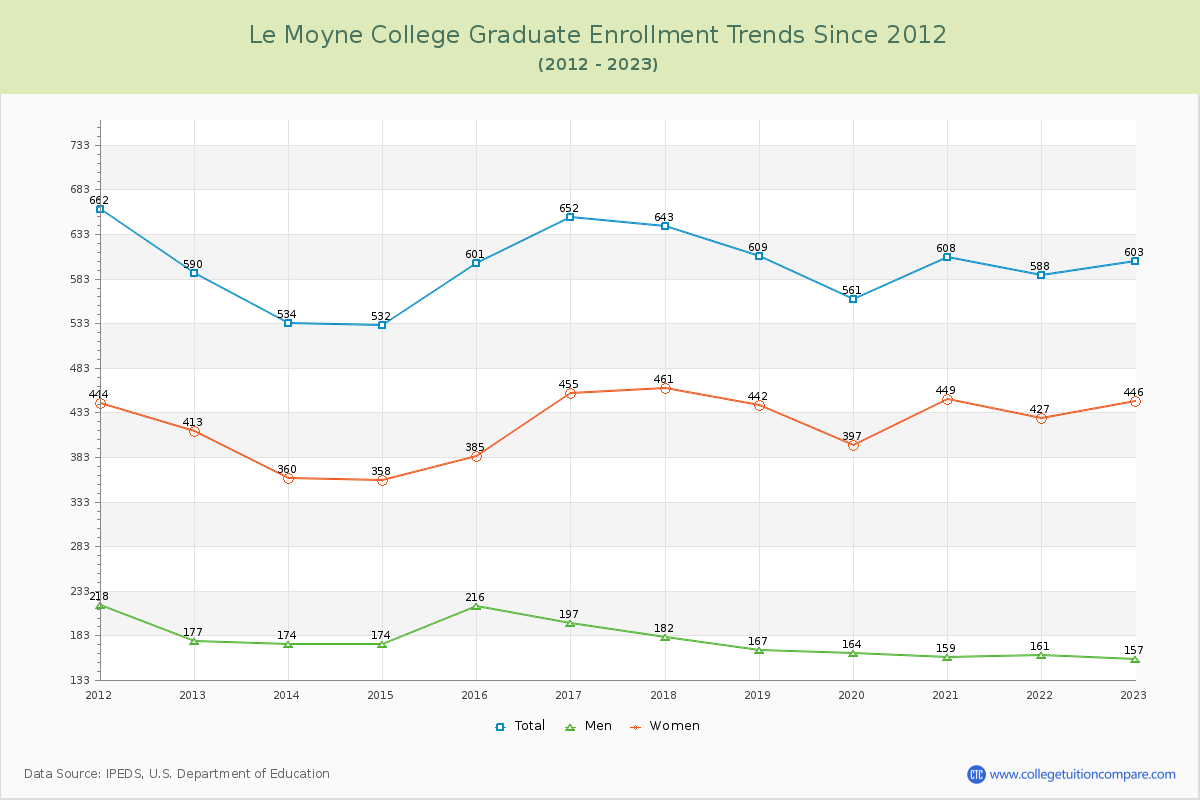
81.17% of total students is undergraduate students and 18.83% students is graduate students. The number of undergraduate students has decreased by 149 and the graduate enrollment has increased by 13 over past 10 years.
The female to male ratio is 1.78 to 1 and it means that there are more female students enrolled in Le Moyne than male students.
The following table and chart illustrate the changes in student population by gender at Le Moyne College since 2012.
| Year | Total | Undergraduate | Graduate | ||||
|---|---|---|---|---|---|---|---|
| Total | Men | Women | Total | Men | Women | ||
| 2012-13 | 3,339 | 2,749 | 1,092 | 1,657 | 590 | 177 | 413 |
| 2013-14 | 3,319 -20 | 2,785 36 | 1,153 61 | 1,632 -25 | 534 -56 | 174 -3 | 360 -53 |
| 2014-15 | 3,381 62 | 2,849 64 | 1,197 44 | 1,652 20 | 532 -2 | 174 0 | 358 -2 |
| 2015-16 | 3,478 97 | 2,877 28 | 1,162 -35 | 1,715 63 | 601 69 | 216 42 | 385 27 |
| 2016-17 | 3,549 71 | 2,897 20 | 1,143 -19 | 1,754 39 | 652 51 | 197 -19 | 455 70 |
| 2017-18 | 3,431 -118 | 2,788 -109 | 1,125 -18 | 1,663 -91 | 643 -9 | 182 -15 | 461 6 |
| 2018-19 | 3,356 -75 | 2,747 -41 | 1,088 -37 | 1,659 -4 | 609 -34 | 167 -15 | 442 -19 |
| 2019-20 | 3,326 -30 | 2,765 18 | 1,090 2 | 1,675 16 | 561 -48 | 164 -3 | 397 -45 |
| 2020-21 | 3,409 83 | 2,801 36 | 1,077 -13 | 1,724 49 | 608 47 | 159 -5 | 449 52 |
| 2021-22 | 3,301 -108 | 2,713 -88 | 1,014 -63 | 1,699 -25 | 588 -20 | 161 2 | 427 -22 |
| 2022-23 | 3,203 -98 | 2,600 -113 | 997 -17 | 1,603 -96 | 603 15 | 157 -4 | 446 19 |
| Average | 3,372 | 2,779 | 1,103 | 1,676 | 593 | 175 | 418 |