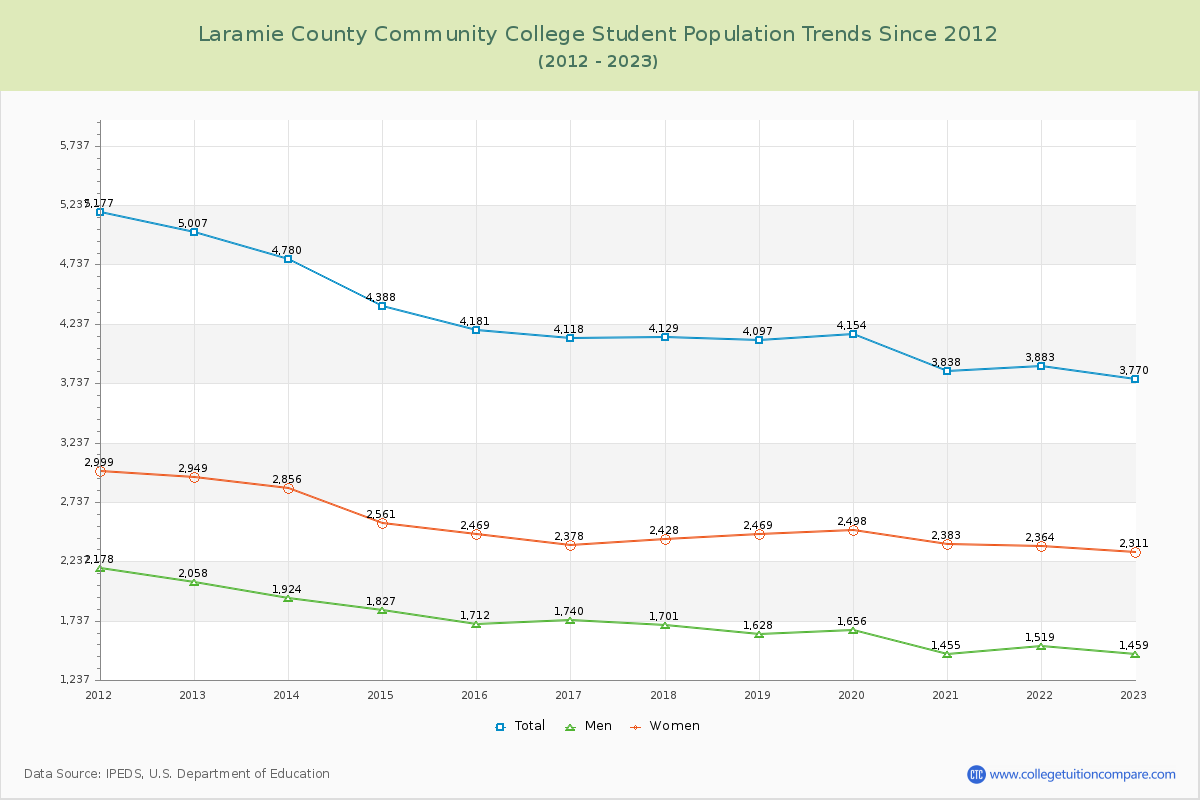
Student Population Changes
The average student population over the last 12 years is 4,213 where 3,770 students are attending the school for the academic year 2022-2023.
The female to male ratio is 1.58 to 1 and it means that there are more female students enrolled in LCCC than male students.
The following table and chart illustrate the changes in student population by gender at Laramie County Community College since 2012.
| Year | Total | Men | Women |
|---|---|---|---|
| 2012-13 | 5,007 | 2,058 | 2,949 |
| 2013-14 | 4,780 -227 | 1,924 -134 | 2,856 -93 |
| 2014-15 | 4,388 -392 | 1,827 -97 | 2,561 -295 |
| 2015-16 | 4,181 -207 | 1,712 -115 | 2,469 -92 |
| 2016-17 | 4,118 -63 | 1,740 28 | 2,378 -91 |
| 2017-18 | 4,129 11 | 1,701 -39 | 2,428 50 |
| 2018-19 | 4,097 -32 | 1,628 -73 | 2,469 41 |
| 2019-20 | 4,154 57 | 1,656 28 | 2,498 29 |
| 2020-21 | 3,838 -316 | 1,455 -201 | 2,383 -115 |
| 2021-22 | 3,883 45 | 1,519 64 | 2,364 -19 |
| 2022-23 | 3,770 -113 | 1,459 -60 | 2,311 -53 |
| Average | 4,213 | 1,698 | 2,515 |