Graduation Rate Changes

The average graduation rate of the last 12 years is 47.09% where the current academic year rate is 0%.
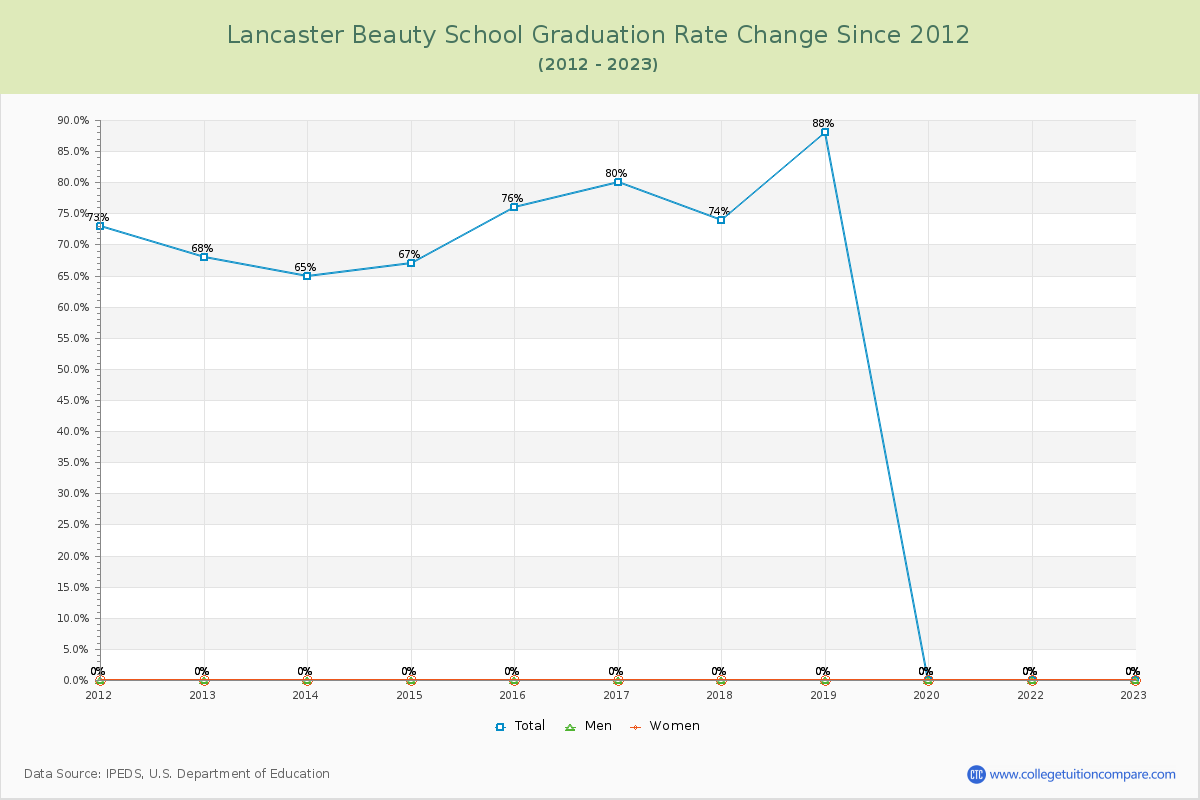
The following table and chart show the changes of graduation rate at Lancaster Beauty School over the past 12 years (2012-2023).
TableInteractive ChartDownloadable Chart
YearTotalMenWomen
2012-13 68%0%0%
2013-14 65%0%0%
2014-15 67%0%0%
2015-16 76%0%0%
2016-17 80%0%0%
2017-18 74%0%0%
2018-19 88%0%0%
2019-20 0%0%0%
2020-21 %%%
2021-22 0%0%0%
2022-23 0%0%0%
Average47.09%0.00%0.00%
Graduation Rate Changes of Lancaster Beauty School
Lancaster Beauty School Graduation Rate Changes Chart

Retention Rate Changes

The average retention rate of the last 12 years is 70.55% (all full-time students).
The following table shows the changes of retention rate at Lancaster Beauty School from 2012 to 2023.
TableChart
YearFull-timePart-time
2012-1378%-
2013-1475%-
2014-1589%-
2015-1695%-
2016-1788%-
2017-1888%-
2018-1989%-
2019-20100%-
2020-21--
2021-22--
2022-2374%-
Average70.55%-
Retention Rate Changes of Lancaster Beauty School

Student to Faculty Ratio Changes

The average student to faculty ratio over the last 12 years is 18.82 to 1 where the current academic year ratio is 22 to 1. The following table and chart illustrate the change of student to faculty ratio at Lancaster Beauty School since 2023.
TableChart
YearStudent to Faculty Ratio
2012-1327:1
2013-1415:1
2014-1521:1
2015-1619:1
2016-1728:1
2017-1818:1
2018-1921:1
2019-2021:1
2020-21:1
2021-2215:1
2022-2322:1
Average18.82:1
Student to Faculty Ratio Changes of Lancaster Beauty School
Related Articles and Ads