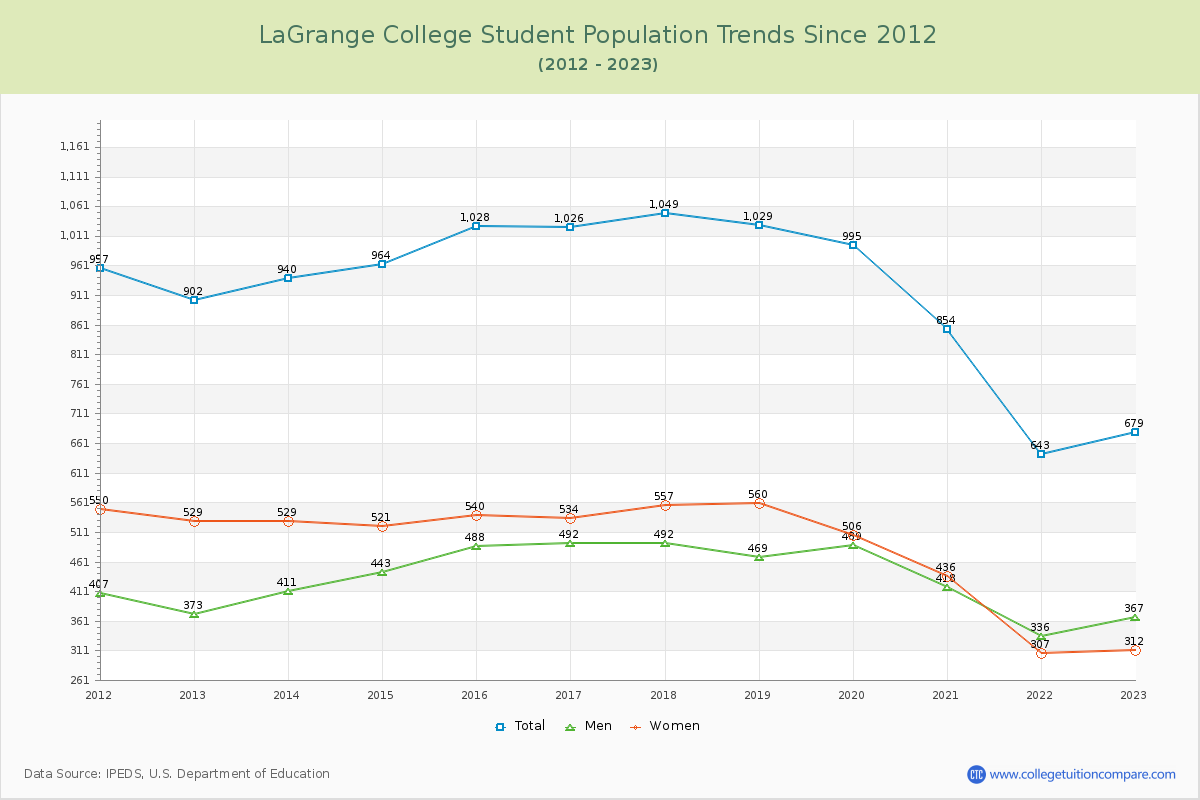
Student Population Changes
The average student population over the last 12 years is 919 where 679 students are attending the school for the academic year 2022-2023.
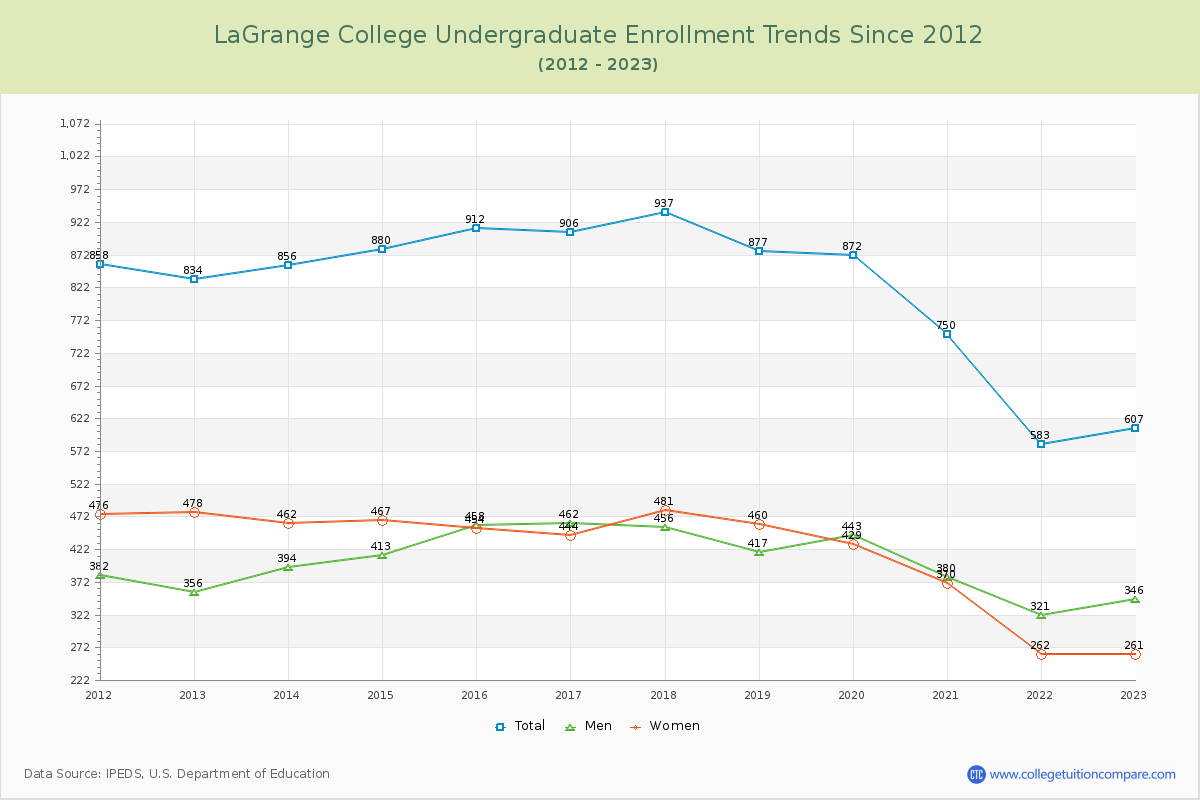
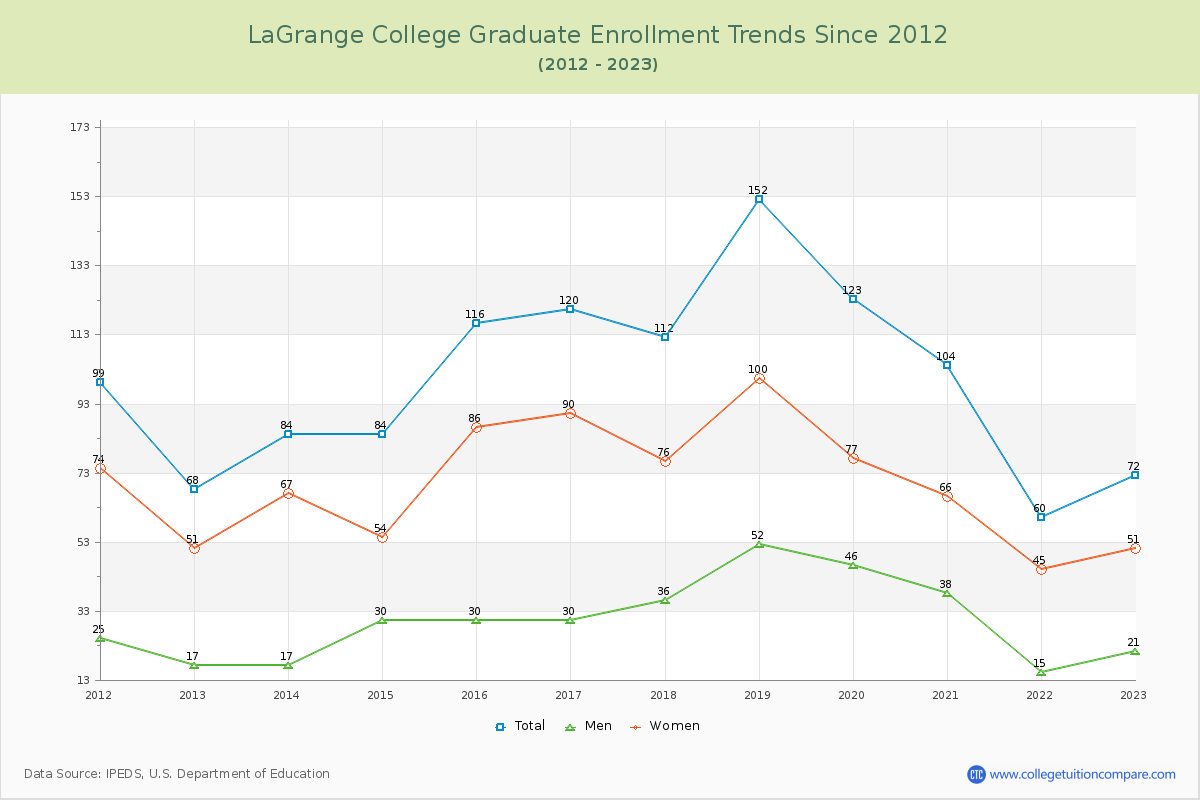
89.40% of total students is undergraduate students and 10.60% students is graduate students. The number of undergraduate students has decreased by 227 and the graduate enrollment has increased by 4 over past 10 years.
The female to male ratio is 0.85 to 1 and it means that there are slightly more male students enrolled in LaGrange than female students.
The following table and chart illustrate the changes in student population by gender at LaGrange College since 2012.
| Year | Total | Undergraduate | Graduate | ||||
|---|---|---|---|---|---|---|---|
| Total | Men | Women | Total | Men | Women | ||
| 2012-13 | 902 | 834 | 356 | 478 | 68 | 17 | 51 |
| 2013-14 | 940 38 | 856 22 | 394 38 | 462 -16 | 84 16 | 17 0 | 67 16 |
| 2014-15 | 964 24 | 880 24 | 413 19 | 467 5 | 84 0 | 30 13 | 54 -13 |
| 2015-16 | 1,028 64 | 912 32 | 458 45 | 454 -13 | 116 32 | 30 0 | 86 32 |
| 2016-17 | 1,026 -2 | 906 -6 | 462 4 | 444 -10 | 120 4 | 30 0 | 90 4 |
| 2017-18 | 1,049 23 | 937 31 | 456 -6 | 481 37 | 112 -8 | 36 6 | 76 -14 |
| 2018-19 | 1,029 -20 | 877 -60 | 417 -39 | 460 -21 | 152 40 | 52 16 | 100 24 |
| 2019-20 | 995 -34 | 872 -5 | 443 26 | 429 -31 | 123 -29 | 46 -6 | 77 -23 |
| 2020-21 | 854 -141 | 750 -122 | 380 -63 | 370 -59 | 104 -19 | 38 -8 | 66 -11 |
| 2021-22 | 643 -211 | 583 -167 | 321 -59 | 262 -108 | 60 -44 | 15 -23 | 45 -21 |
| 2022-23 | 679 36 | 607 24 | 346 25 | 261 -1 | 72 12 | 21 6 | 51 6 |
| Average | 919 | 819 | 404 | 415 | 100 | 30 | 69 |