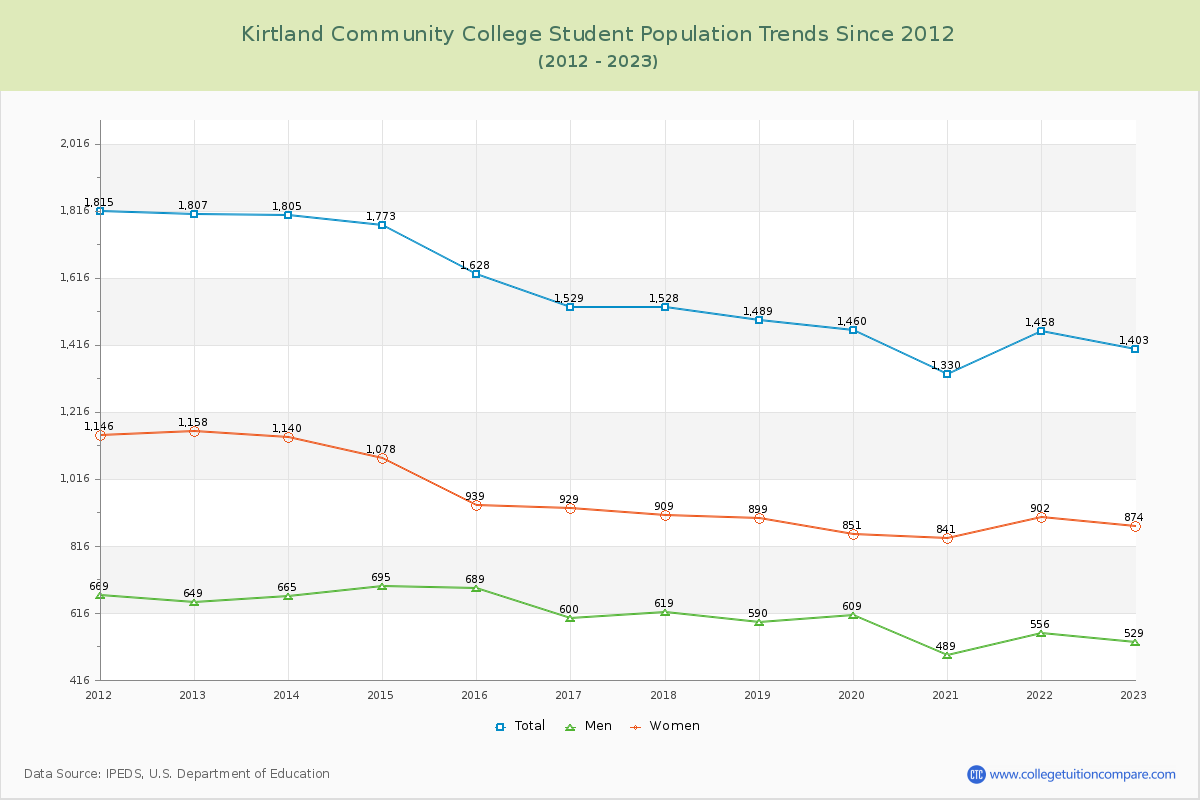
Student Population Changes
The average student population over the last 12 years is 1,565 where 1,403 students are attending the school for the academic year 2022-2023.
The female to male ratio is 1.65 to 1 and it means that there are more female students enrolled in Kirtland CC than male students.
The following table and chart illustrate the changes in student population by gender at Kirtland Community College since 2012.
| Year | Total | Men | Women |
|---|---|---|---|
| 2012-13 | 1,807 | 649 | 1,158 |
| 2013-14 | 1,805 -2 | 665 16 | 1,140 -18 |
| 2014-15 | 1,773 -32 | 695 30 | 1,078 -62 |
| 2015-16 | 1,628 -145 | 689 -6 | 939 -139 |
| 2016-17 | 1,529 -99 | 600 -89 | 929 -10 |
| 2017-18 | 1,528 -1 | 619 19 | 909 -20 |
| 2018-19 | 1,489 -39 | 590 -29 | 899 -10 |
| 2019-20 | 1,460 -29 | 609 19 | 851 -48 |
| 2020-21 | 1,330 -130 | 489 -120 | 841 -10 |
| 2021-22 | 1,458 128 | 556 67 | 902 61 |
| 2022-23 | 1,403 -55 | 529 -27 | 874 -28 |
| Average | 1,565 | 608 | 956 |