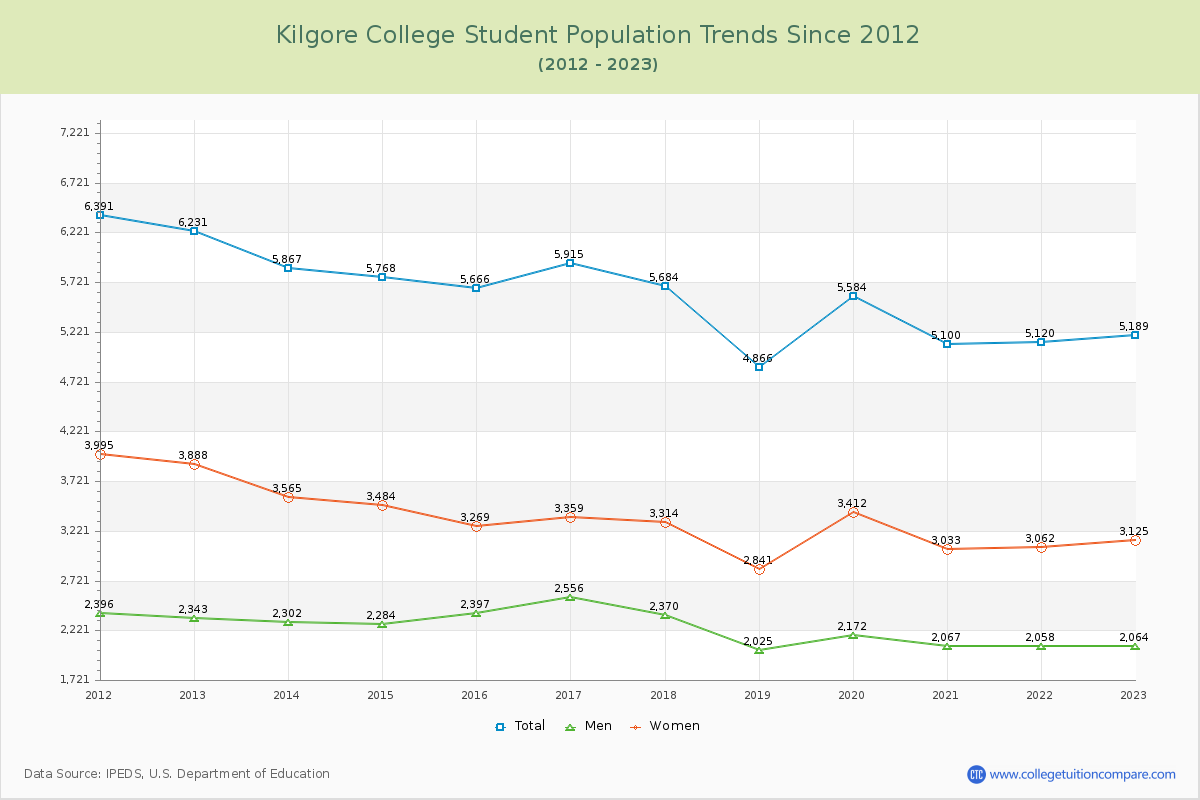
Student Population Changes
The average student population over the last 12 years is 5,545 where 5,189 students are attending the school for the academic year 2022-2023.
The female to male ratio is 1.51 to 1 and it means that there are more female students enrolled in Kilgore than male students.
The following table and chart illustrate the changes in student population by gender at Kilgore College since 2012.
| Year | Total | Men | Women |
|---|---|---|---|
| 2012-13 | 6,231 | 2,343 | 3,888 |
| 2013-14 | 5,867 -364 | 2,302 -41 | 3,565 -323 |
| 2014-15 | 5,768 -99 | 2,284 -18 | 3,484 -81 |
| 2015-16 | 5,666 -102 | 2,397 113 | 3,269 -215 |
| 2016-17 | 5,915 249 | 2,556 159 | 3,359 90 |
| 2017-18 | 5,684 -231 | 2,370 -186 | 3,314 -45 |
| 2018-19 | 4,866 -818 | 2,025 -345 | 2,841 -473 |
| 2019-20 | 5,584 718 | 2,172 147 | 3,412 571 |
| 2020-21 | 5,100 -484 | 2,067 -105 | 3,033 -379 |
| 2021-22 | 5,120 20 | 2,058 -9 | 3,062 29 |
| 2022-23 | 5,189 69 | 2,064 6 | 3,125 63 |
| Average | 5,545 | 2,240 | 3,305 |