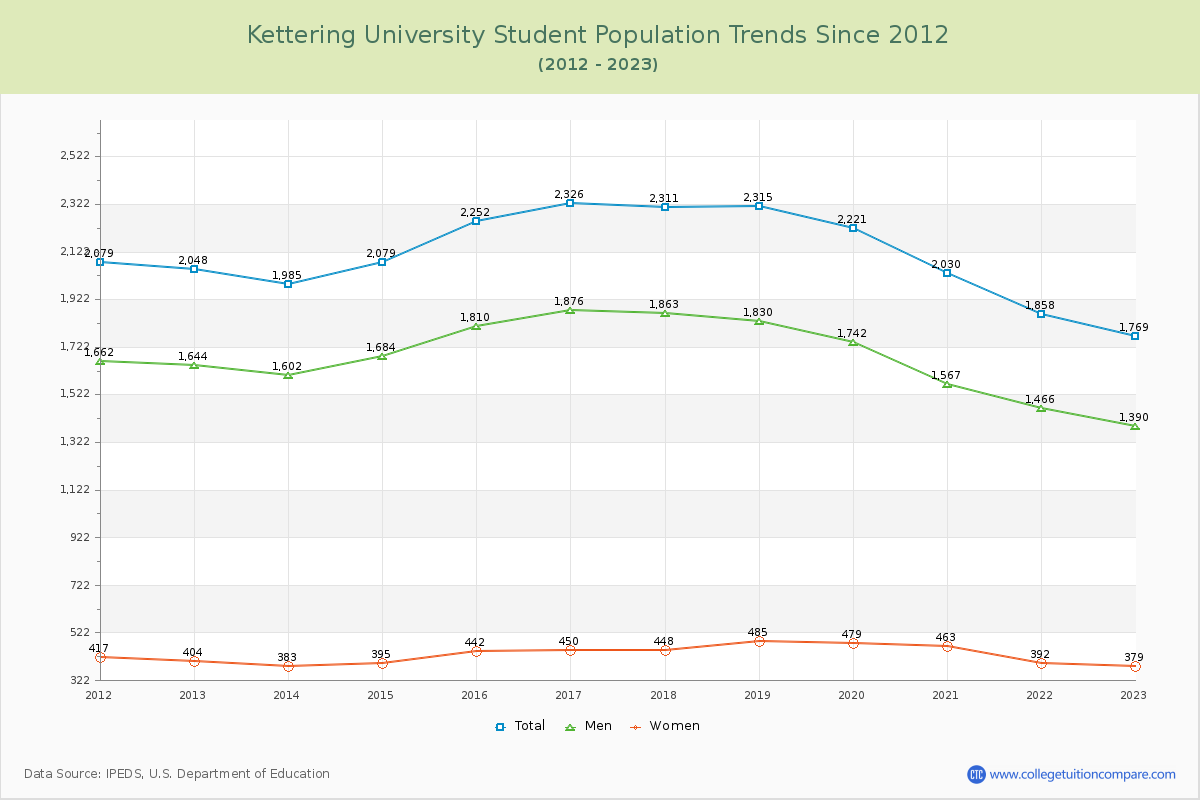
Student Population Changes
The average student population over the last 12 years is 2,109 where 1,769 students are attending the school for the academic year 2022-2023.
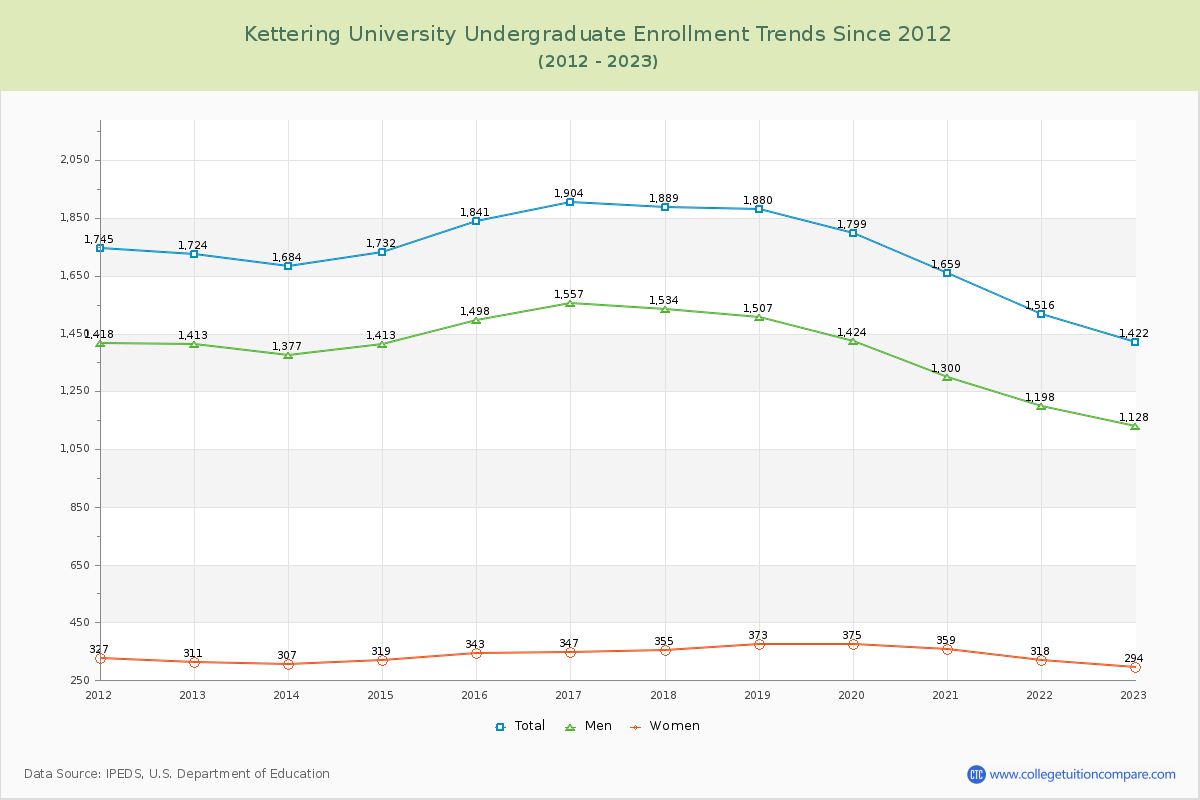
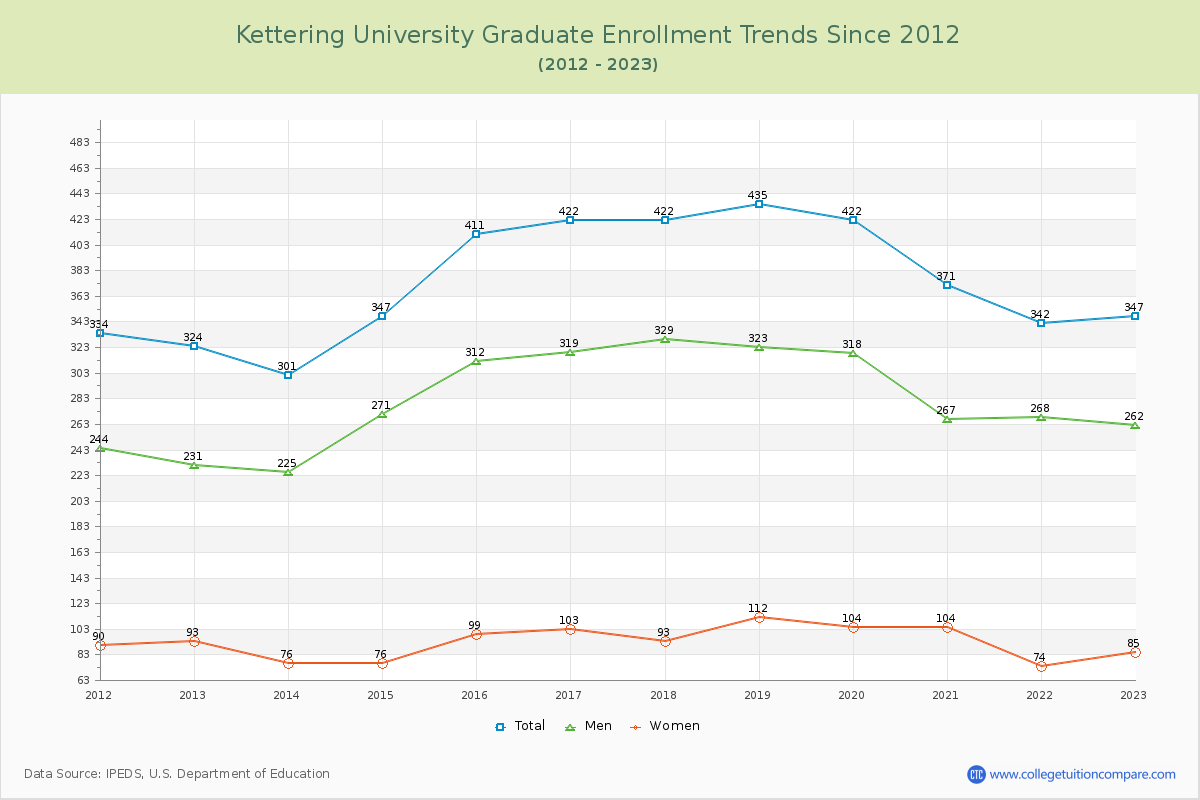
80.38% of total students is undergraduate students and 19.62% students is graduate students. The number of undergraduate students has decreased by 302 and the graduate enrollment has increased by 23 over past 10 years.
The female to male ratio is 0.27 to 1 and it means that there are far more male students enrolled in Kettering than female students.
The following table and chart illustrate the changes in student population by gender at Kettering University since 2012.
| Year | Total | Undergraduate | Graduate | ||||
|---|---|---|---|---|---|---|---|
| Total | Men | Women | Total | Men | Women | ||
| 2012-13 | 2,048 | 1,724 | 1,413 | 311 | 324 | 231 | 93 |
| 2013-14 | 1,985 -63 | 1,684 -40 | 1,377 -36 | 307 -4 | 301 -23 | 225 -6 | 76 -17 |
| 2014-15 | 2,079 94 | 1,732 48 | 1,413 36 | 319 12 | 347 46 | 271 46 | 76 0 |
| 2015-16 | 2,252 173 | 1,841 109 | 1,498 85 | 343 24 | 411 64 | 312 41 | 99 23 |
| 2016-17 | 2,326 74 | 1,904 63 | 1,557 59 | 347 4 | 422 11 | 319 7 | 103 4 |
| 2017-18 | 2,311 -15 | 1,889 -15 | 1,534 -23 | 355 8 | 422 0 | 329 10 | 93 -10 |
| 2018-19 | 2,315 4 | 1,880 -9 | 1,507 -27 | 373 18 | 435 13 | 323 -6 | 112 19 |
| 2019-20 | 2,221 -94 | 1,799 -81 | 1,424 -83 | 375 2 | 422 -13 | 318 -5 | 104 -8 |
| 2020-21 | 2,030 -191 | 1,659 -140 | 1,300 -124 | 359 -16 | 371 -51 | 267 -51 | 104 0 |
| 2021-22 | 1,858 -172 | 1,516 -143 | 1,198 -102 | 318 -41 | 342 -29 | 268 1 | 74 -30 |
| 2022-23 | 1,769 -89 | 1,422 -94 | 1,128 -70 | 294 -24 | 347 5 | 262 -6 | 85 11 |
| Average | 2,109 | 1,732 | 1,395 | 336 | 377 | 284 | 93 |