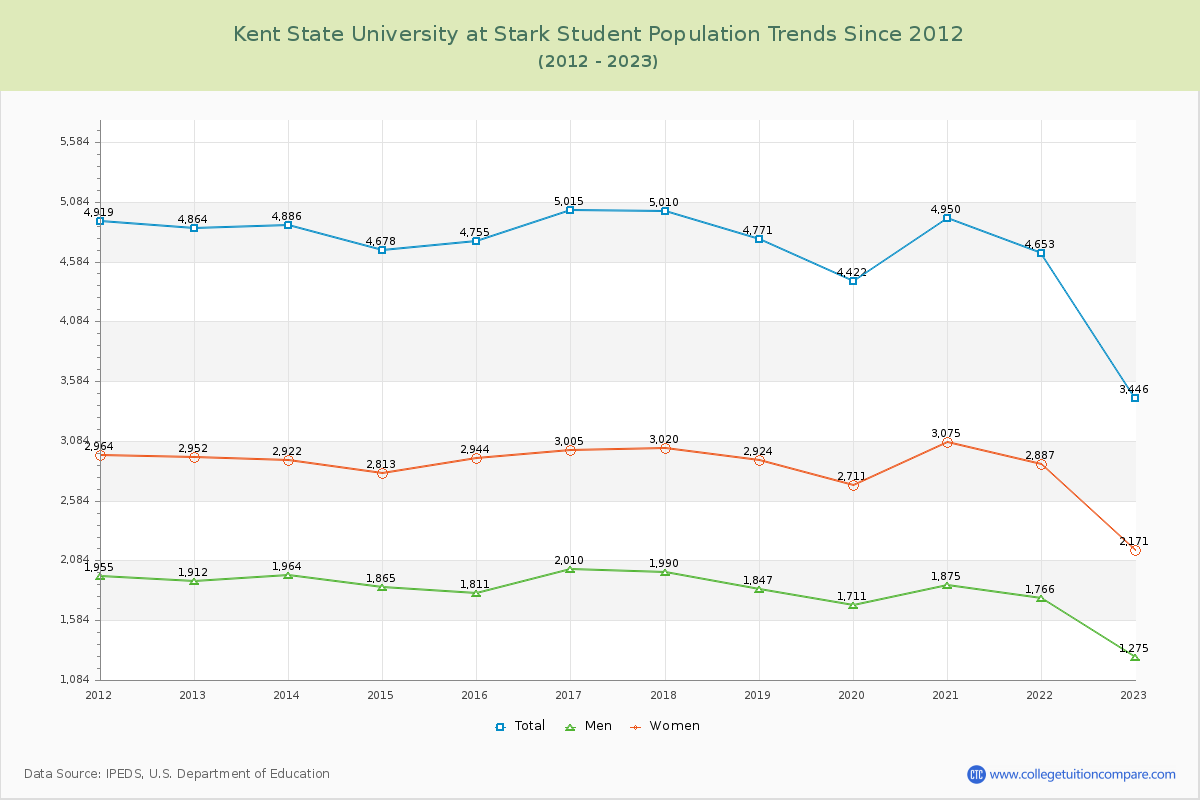
Student Population Changes
The average student population over the last 12 years is 4,677 where 3,446 students are attending the school for the academic year 2022-2023.
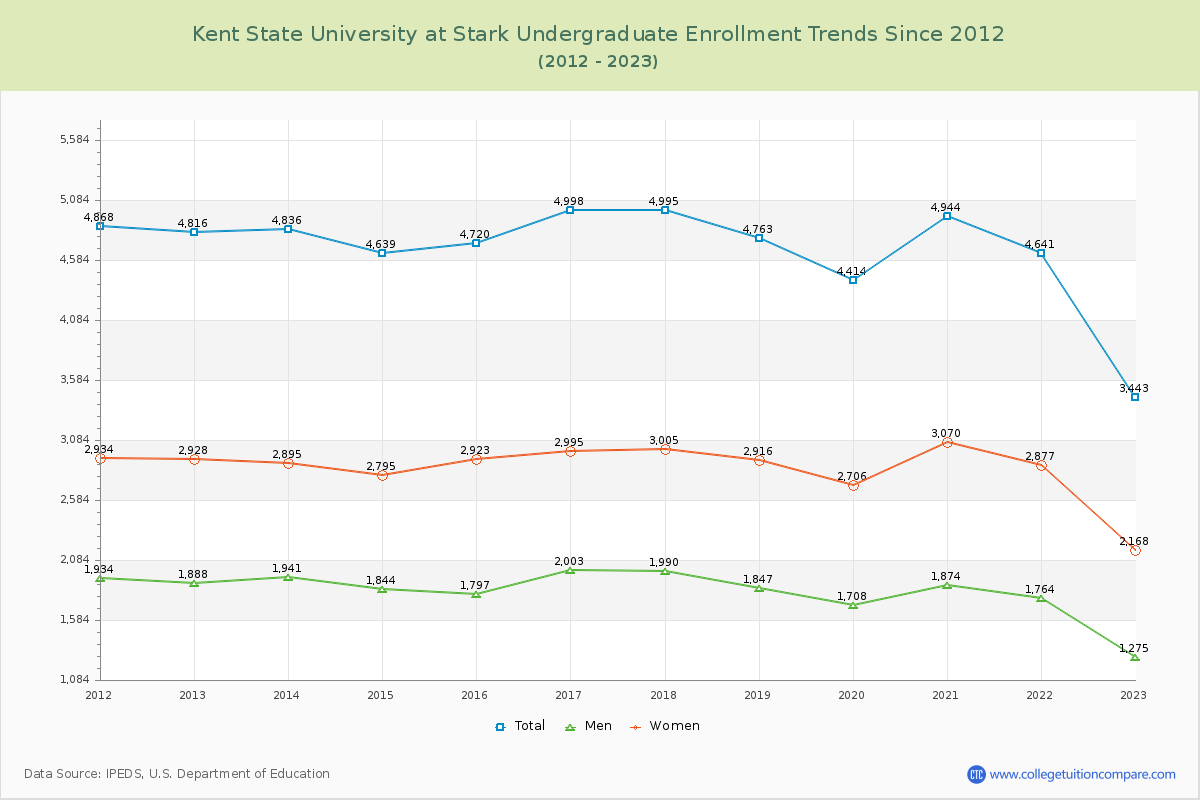
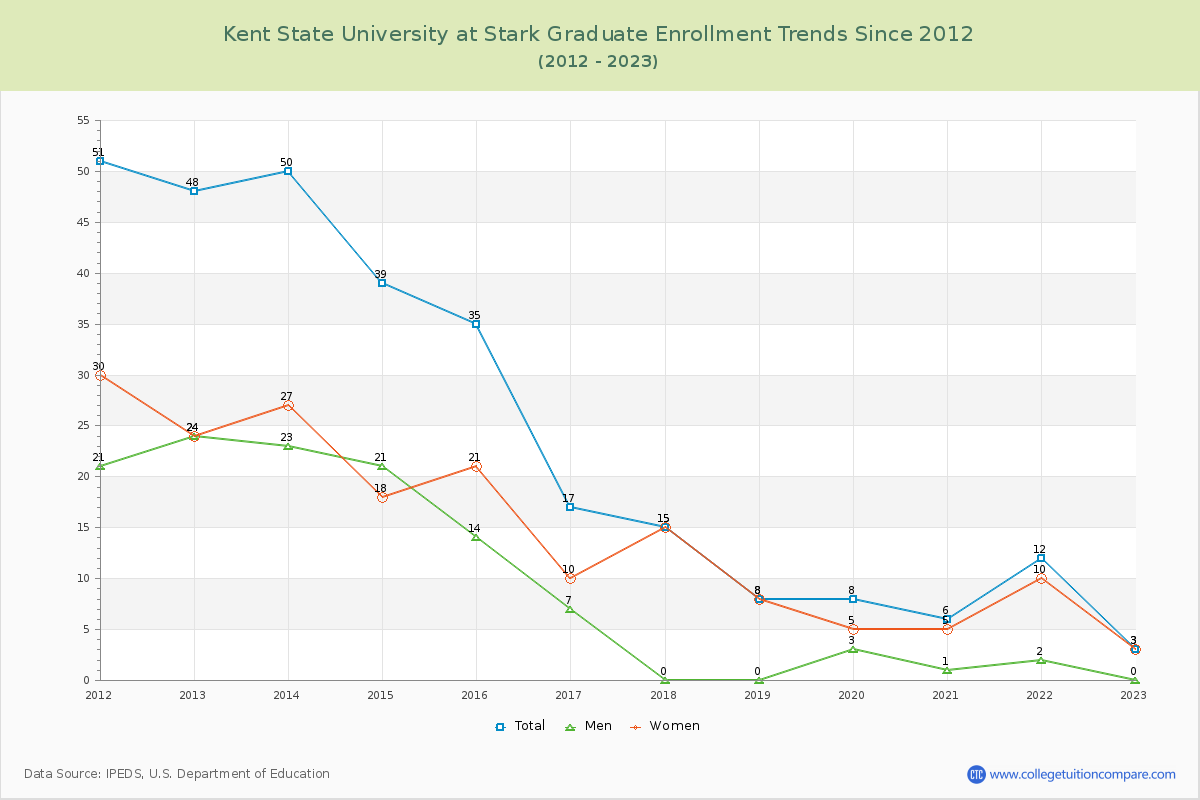
99.91% of total students is undergraduate students and 0.09% students is graduate students. The number of undergraduate students has decreased by 1,373 and the graduate enrollment has decreased by 45 over past 10 years.
The female to male ratio is 1.70 to 1 and it means that there are more female students enrolled in Kent State University at Stark than male students.
The following table and chart illustrate the changes in student population by gender at Kent State University at Stark since 2012.
| Year | Total | Undergraduate | Graduate | ||||
|---|---|---|---|---|---|---|---|
| Total | Men | Women | Total | Men | Women | ||
| 2012-13 | 4,864 | 4,816 | 1,888 | 2,928 | 48 | 24 | 24 |
| 2013-14 | 4,886 22 | 4,836 20 | 1,941 53 | 2,895 -33 | 50 2 | 23 -1 | 27 3 |
| 2014-15 | 4,678 -208 | 4,639 -197 | 1,844 -97 | 2,795 -100 | 39 -11 | 21 -2 | 18 -9 |
| 2015-16 | 4,755 77 | 4,720 81 | 1,797 -47 | 2,923 128 | 35 -4 | 14 -7 | 21 3 |
| 2016-17 | 5,015 260 | 4,998 278 | 2,003 206 | 2,995 72 | 17 -18 | 7 -7 | 10 -11 |
| 2017-18 | 5,010 -5 | 4,995 -3 | 1,990 -13 | 3,005 10 | 15 -2 | 0 -7 | 15 5 |
| 2018-19 | 4,771 -239 | 4,763 -232 | 1,847 -143 | 2,916 -89 | 8 -7 | 0 0 | 8 -7 |
| 2019-20 | 4,422 -349 | 4,414 -349 | 1,708 -139 | 2,706 -210 | 8 0 | 3 3 | 5 -3 |
| 2020-21 | 4,950 528 | 4,944 530 | 1,874 166 | 3,070 364 | 6 -2 | 1 -2 | 5 0 |
| 2021-22 | 4,653 -297 | 4,641 -303 | 1,764 -110 | 2,877 -193 | 12 6 | 2 1 | 10 5 |
| 2022-23 | 3,446 -1,207 | 3,443 -1,198 | 1,275 -489 | 2,168 -709 | 3 -9 | 0 -2 | 3 -7 |
| Average | 4,677 | 4,655 | 1,812 | 2,843 | 22 | 9 | 13 |