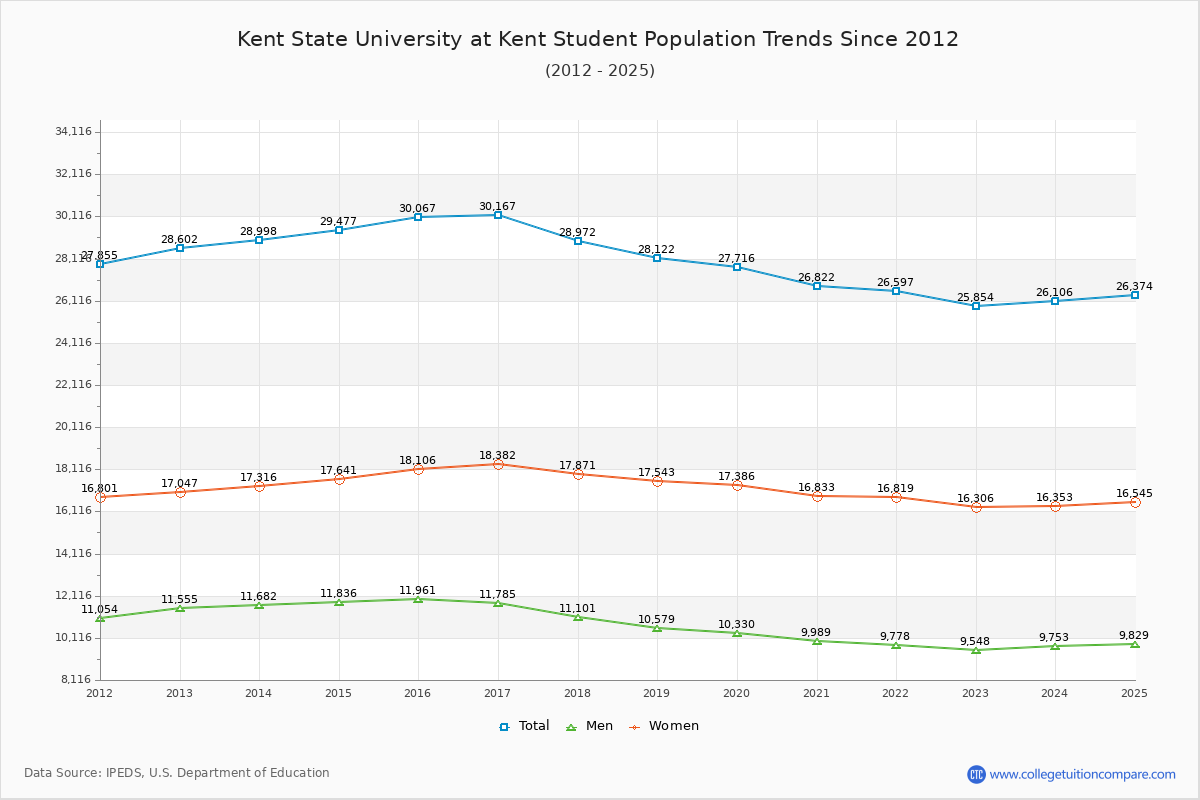
Student Population Changes
The average student population over the last 12 years is 28,309 where 25,854 students are attending the school for the academic year 2022-2023.
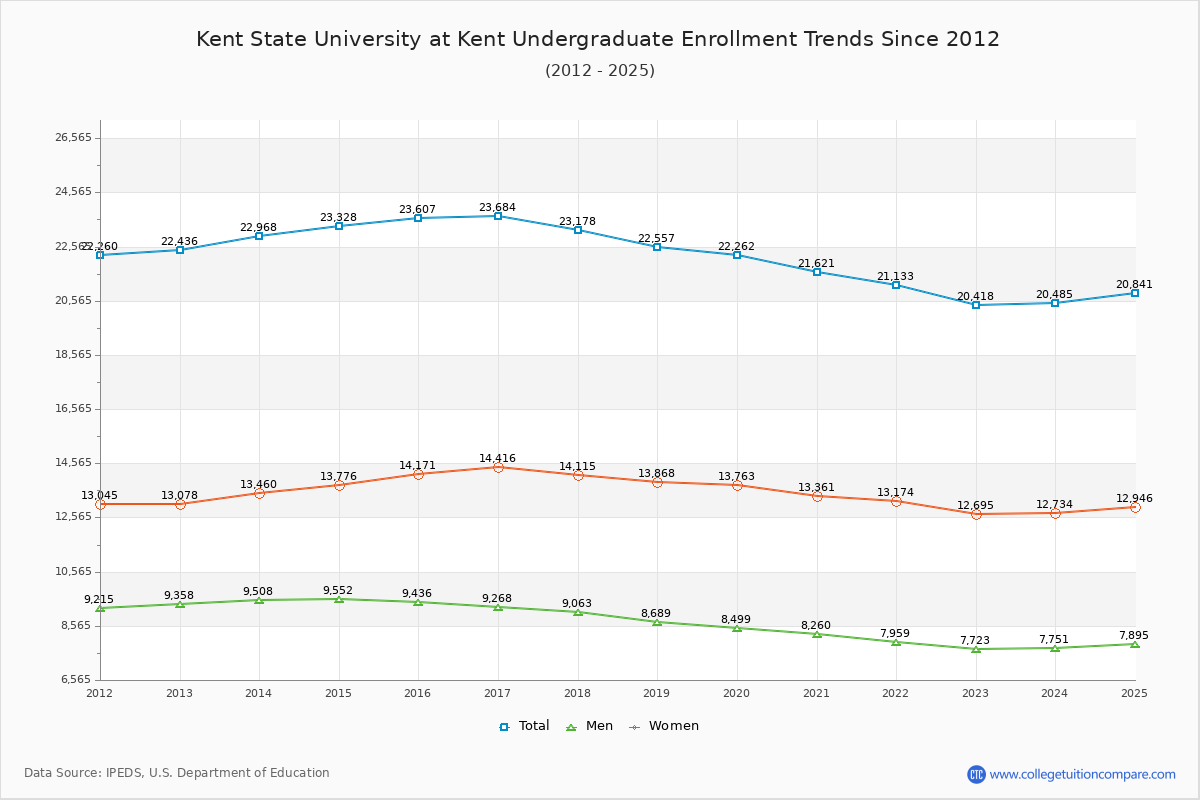
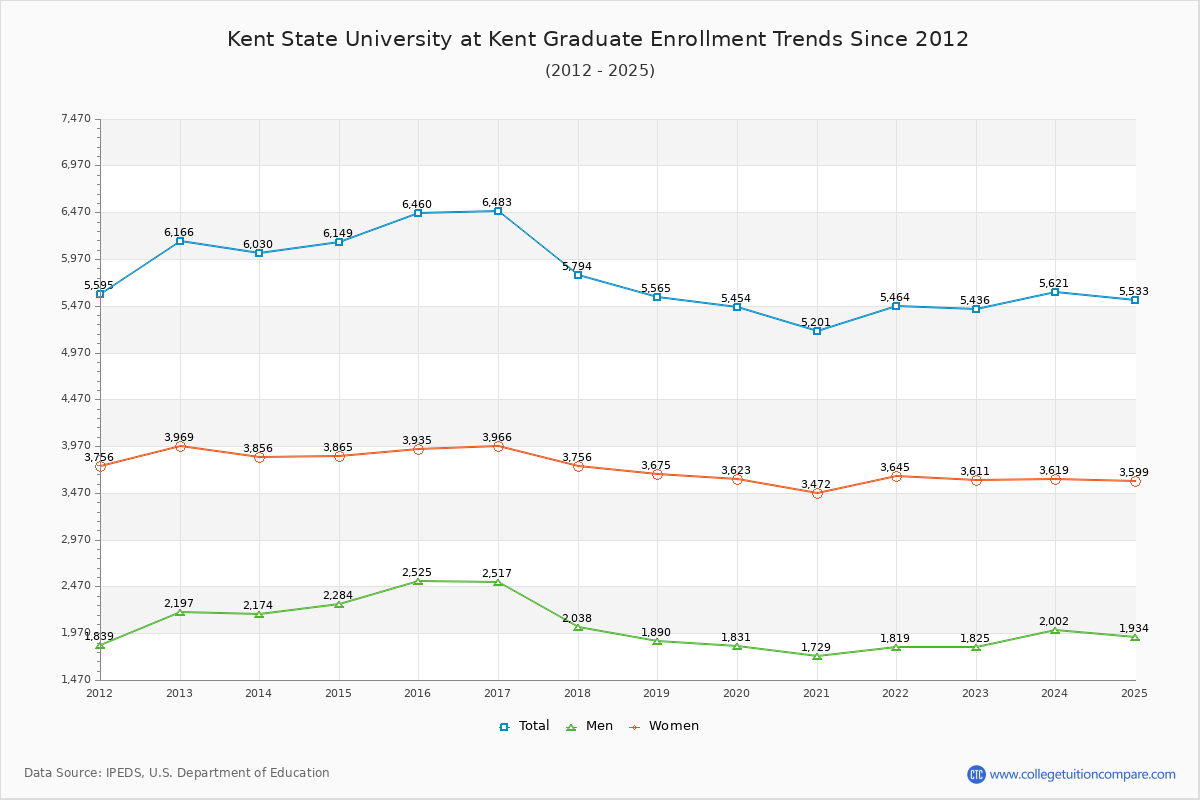
78.97% of total students is undergraduate students and 21.03% students is graduate students. The number of undergraduate students has decreased by 2,018 and the graduate enrollment has decreased by 730 over past 10 years.
The female to male ratio is 1.71 to 1 and it means that there are more female students enrolled in Kent State University at Kent than male students.
The following table and chart illustrate the changes in student population by gender at Kent State University at Kent since 2012.
| Year | Total | Undergraduate | Graduate | ||||
|---|---|---|---|---|---|---|---|
| Total | Men | Women | Total | Men | Women | ||
| 2012-13 | 28,602 | 22,436 | 9,358 | 13,078 | 6,166 | 2,197 | 3,969 |
| 2013-14 | 28,998 396 | 22,968 532 | 9,508 150 | 13,460 382 | 6,030 -136 | 2,174 -23 | 3,856 -113 |
| 2014-15 | 29,477 479 | 23,328 360 | 9,552 44 | 13,776 316 | 6,149 119 | 2,284 110 | 3,865 9 |
| 2015-16 | 30,067 590 | 23,607 279 | 9,436 -116 | 14,171 395 | 6,460 311 | 2,525 241 | 3,935 70 |
| 2016-17 | 30,167 100 | 23,684 77 | 9,268 -168 | 14,416 245 | 6,483 23 | 2,517 -8 | 3,966 31 |
| 2017-18 | 28,972 -1,195 | 23,178 -506 | 9,063 -205 | 14,115 -301 | 5,794 -689 | 2,038 -479 | 3,756 -210 |
| 2018-19 | 28,122 -850 | 22,557 -621 | 8,689 -374 | 13,868 -247 | 5,565 -229 | 1,890 -148 | 3,675 -81 |
| 2019-20 | 27,716 -406 | 22,262 -295 | 8,499 -190 | 13,763 -105 | 5,454 -111 | 1,831 -59 | 3,623 -52 |
| 2020-21 | 26,822 -894 | 21,621 -641 | 8,260 -239 | 13,361 -402 | 5,201 -253 | 1,729 -102 | 3,472 -151 |
| 2021-22 | 26,597 -225 | 21,133 -488 | 7,959 -301 | 13,174 -187 | 5,464 263 | 1,819 90 | 3,645 173 |
| 2022-23 | 25,854 -743 | 20,418 -715 | 7,723 -236 | 12,695 -479 | 5,436 -28 | 1,825 6 | 3,611 -34 |
| Average | 28,309 | 22,472 | 8,847 | 13,625 | 5,837 | 2,075 | 3,761 |