Enrollment Trends at Kent State University at Geauga

-327

Total Enrollment

-169

Men

-158

Women

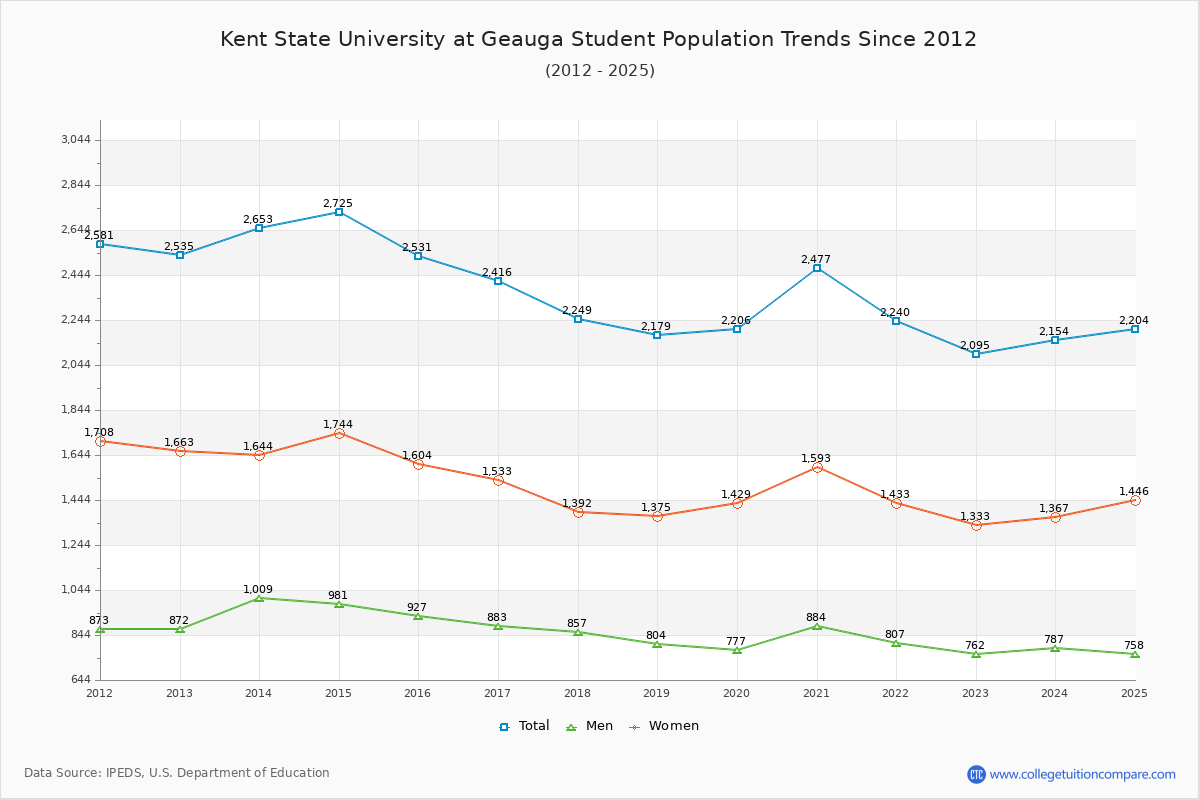
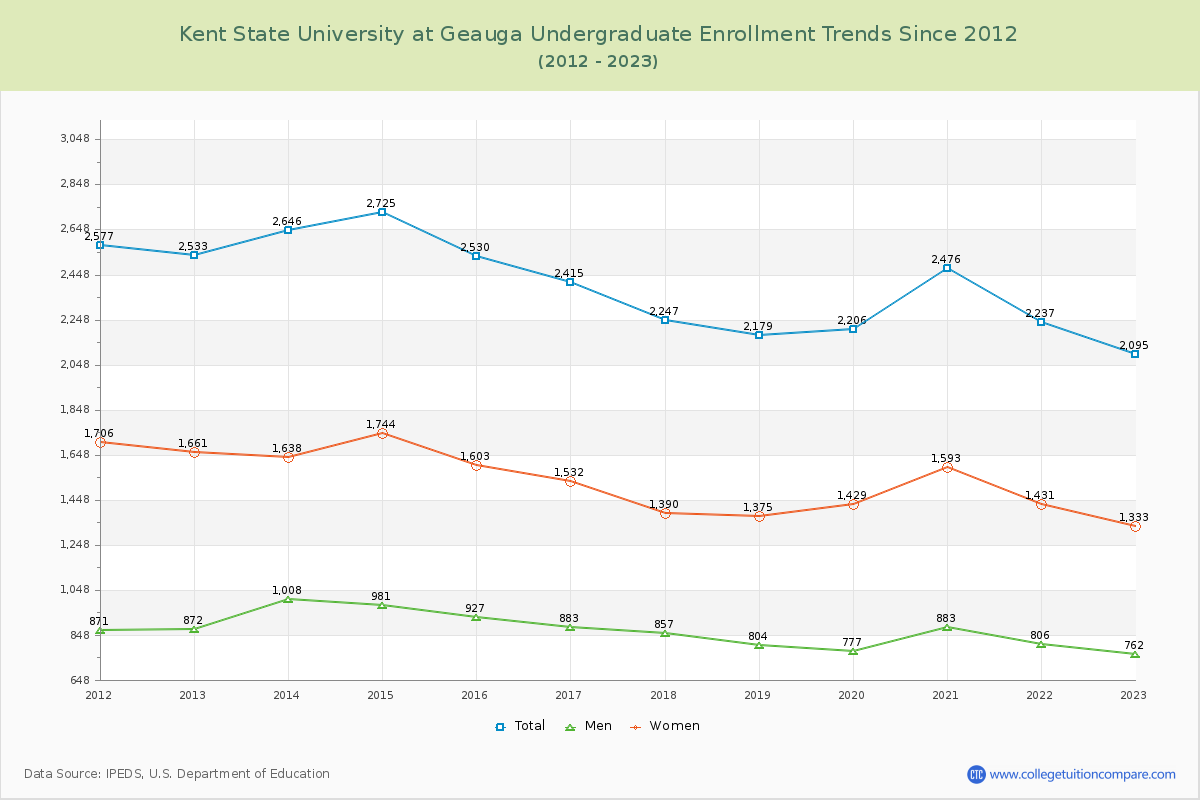
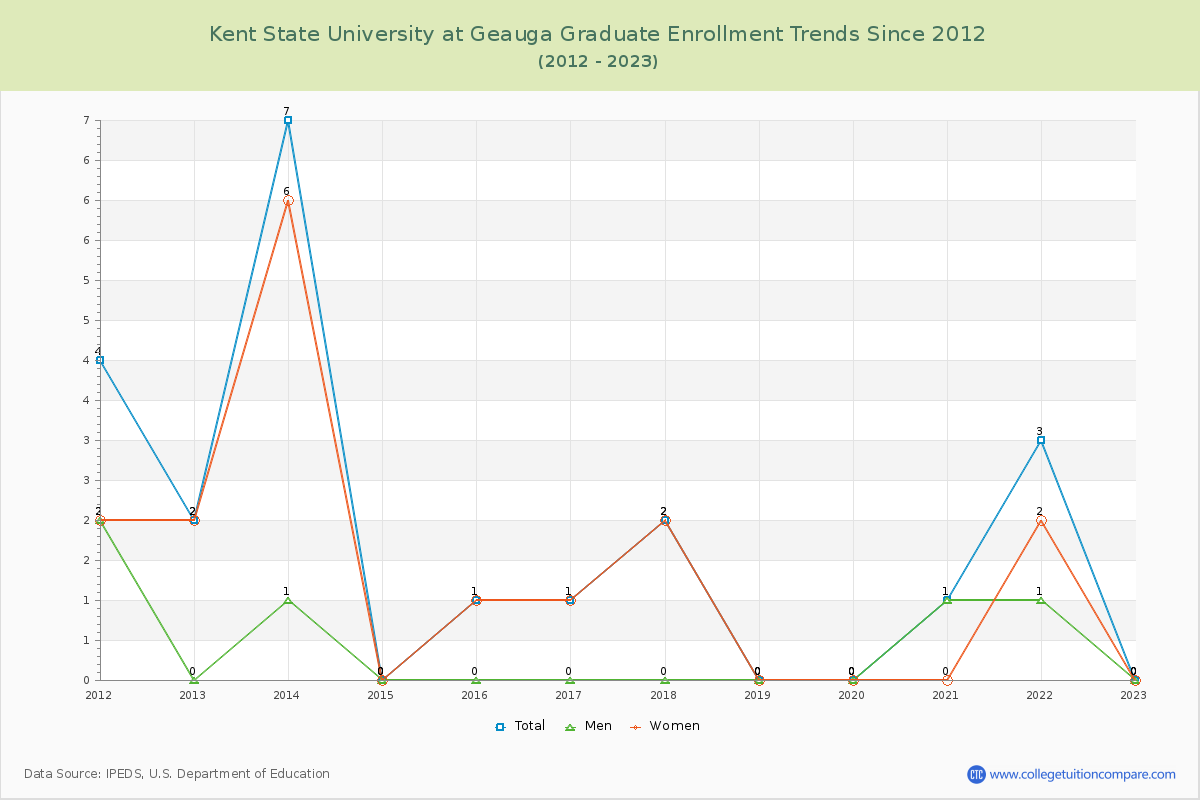
The student population at Kent State University at Geauga is 2,204 (all undergraduate). The number of students has decreased by 327 over the past decade.

The female to male ratio is 1.91 to 1 which means that female students enrolled more than male students.

1,450 students enrolled in online degree program exclusively and the number of online students has increased by 46.91% since 2015.

Student Population Changes

The average student population over the last 11 years is 2,274 where 2,204 students are attending the school for the academic year 2024-2025.

The female to male ratio is 1.91 to 1 and it means that there are more female students enrolled in Kent State University at Geauga than male students.

The following table and chart illustrate the changes in student population by gender at Kent State University at Geauga since 2015.

YearTotalMenWomen
2015-162,5309271,603
2016-172,415
-115
883
-44
1,532
-71
2017-182,247
-168
857
-26
1,390
-142
2018-192,179
-68
804
-53
1,375
-15
2019-202,206
27
777
-27
1,429
54
2020-212,476
270
883
106
1,593
164
2021-222,237
-239
806
-77
1,431
-162
2022-232,095
-142
762
-44
1,333
-98
2023-242,154
59
787
25
1,367
34
2024-252,204
50
758
-29
1,446
79
Average2,2748241,450
Kent State University at Geauga Enrollment Trends Chart

Enrollment by Race/Ethnicity Changes

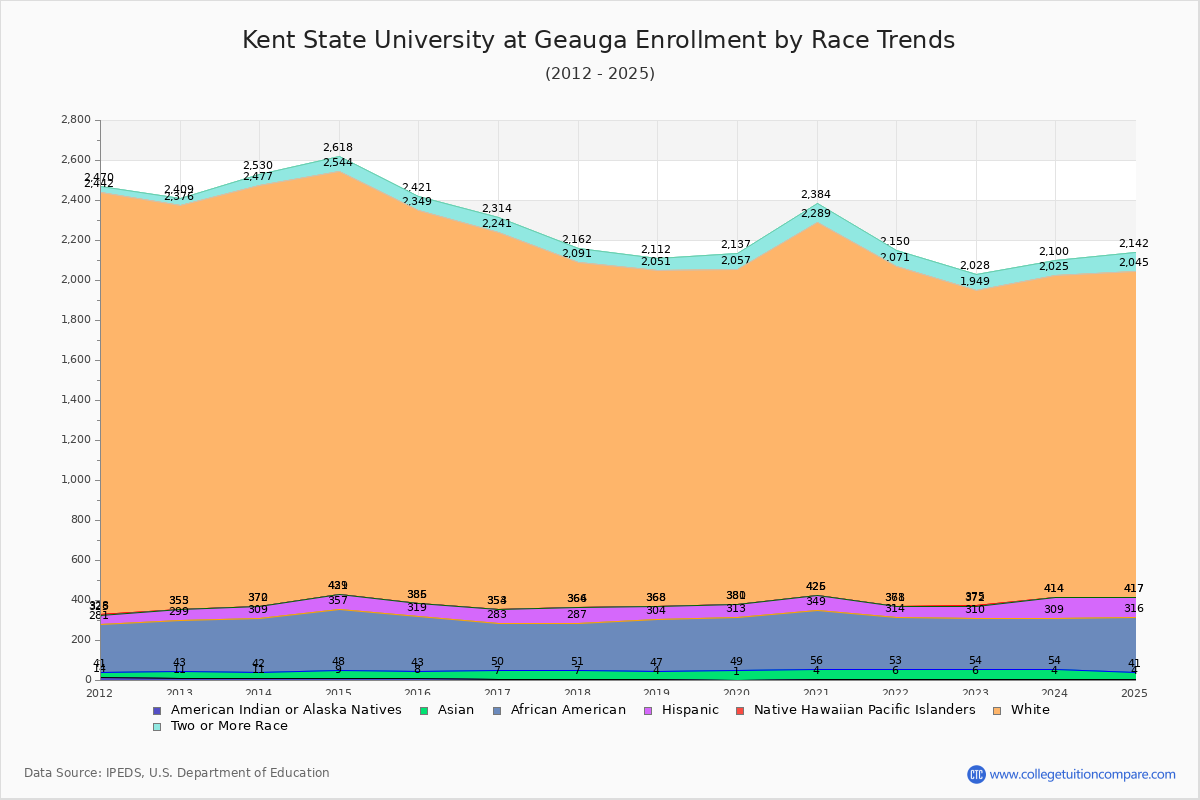
The percentage of white students is 73.87%. The percentage was 77.56% 10 years ago and Kent State University at Geauga still has a high percentage of white students. 1.68% of enrolled students is Asian and 12.48% is black students. Hispanic students comprise 4.58% of the student body.

Over the past 10 years, the racial composition has shifted. The percentage of white students decreased from 77.56% to 73.87%. Asian enrollment grew from 1.38% to 1.68%. Black student enrollment increased from 10.90% to 12.48%. Hispanic student representation expanded from 2.61% to 4.58%.

The overall racial diversity, measured by the Census Bureau Diversity Index, is 0.4345 which indicates that somewhat diverse. This increased from 0.3849 a decade ago, suggesting that racial diversity has improved.

The following table and chart illustrate the student population trends by race/ethnicity at Kent State University at Geauga over the past 11 years (2015-2025).

YearAmerican Indian or Native AmericanAsianBlackHispanicNative Hawaiian or Other Pacific IslanderWhiteTwo or More Races
2015-168352766611,96372
2016-177432337011,88773
2017-187442367721,72571
2018-194432576401,68361
2019-201482646711,67680
2020-214522937611,86395
2021-226472615431,70079
2022-236482566231,57479
2023-2445025510501,61175
2024-2543727510101,62897
Average5452617411,73178
Kent State University at Geauga Enrollment by Race Trends Chart

Distance Learning (Online Courses) Enrollment Changes

1,450 students are enrolled in online degree programs exclusively for the academic year 2024-2025, which is 66% of total students. The number of online students has increased 46.91% since 2015. The following table and chart illustrate the changes in the online student population by enrolled type at Kent State University at Geauga from 2015 to 2025.

YearTotal EnrollmentOnline CompletelyEnrolled in Some Online CoursesNot Enrolled in Online Courses
2015-162,5319873651,179
2016-172,4168953641,157
2017-182,249921334994
2018-192,179961297921
2019-202,206930320956
2020-212,4771,0163281,133
2021-222,2401,580366294
2022-232,0951,163436496
2023-242,1541,273380501
2024-252,2041,450291463
Average2,2751,118348809

Ratings & Review

Share your experiences and thoughts about Kent State University at Geauga. It will be a great help to applicants and prospective students!