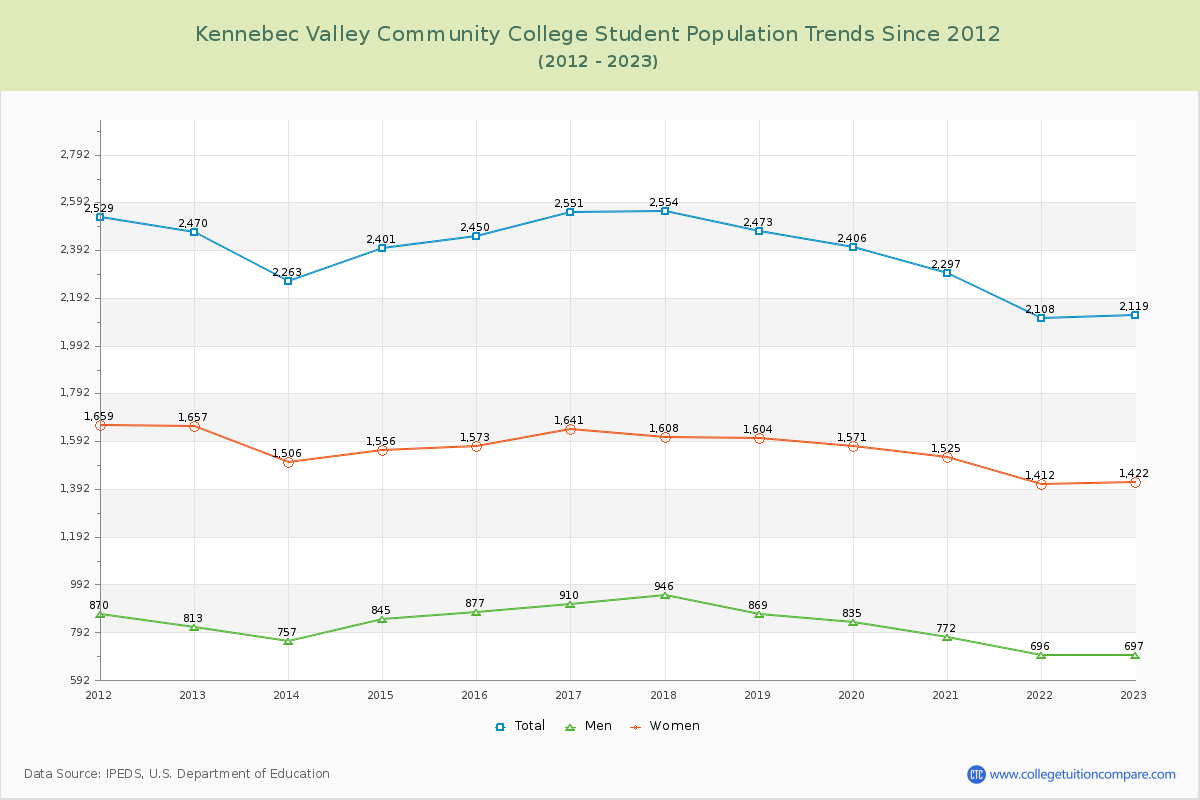
Student Population Changes
The average student population over the last 12 years is 2,372 where 2,119 students are attending the school for the academic year 2022-2023.
The female to male ratio is 2.04 to 1 and it means that there are far more female students enrolled in Kennebec Valley CC than male students.
The following table and chart illustrate the changes in student population by gender at Kennebec Valley Community College since 2012.
| Year | Total | Men | Women |
|---|---|---|---|
| 2012-13 | 2,470 | 813 | 1,657 |
| 2013-14 | 2,263 -207 | 757 -56 | 1,506 -151 |
| 2014-15 | 2,401 138 | 845 88 | 1,556 50 |
| 2015-16 | 2,450 49 | 877 32 | 1,573 17 |
| 2016-17 | 2,551 101 | 910 33 | 1,641 68 |
| 2017-18 | 2,554 3 | 946 36 | 1,608 -33 |
| 2018-19 | 2,473 -81 | 869 -77 | 1,604 -4 |
| 2019-20 | 2,406 -67 | 835 -34 | 1,571 -33 |
| 2020-21 | 2,297 -109 | 772 -63 | 1,525 -46 |
| 2021-22 | 2,108 -189 | 696 -76 | 1,412 -113 |
| 2022-23 | 2,119 11 | 697 1 | 1,422 10 |
| Average | 2,372 | 820 | 1,552 |