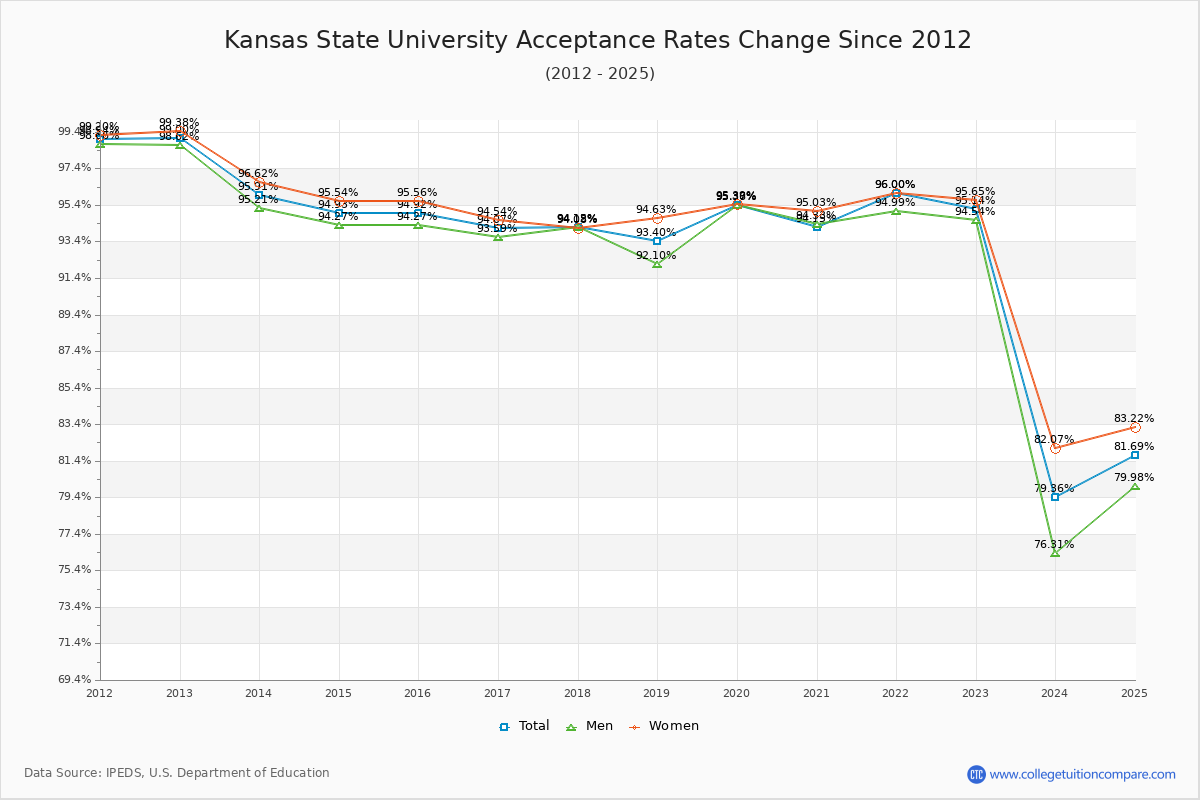
Acceptance Rate Changes
The average acceptance rate over the last 10 years is 95.18%, and this year's acceptance rate is 95.14% at Kansas State University. By gender, men students' acceptance rate is 94.68% and women students' rate is 95.68%.
The next table and chart illustrate the acceptance rates changes at Kansas State University over the past 11 years (2012-2023).
| Year | Total | Men | Women |
|---|---|---|---|
| 2012-13 | 99.00% | 98.62% | 99.38% |
| 2013-14 | 95.91% -3.08% |
95.21% -2.76% |
96.62% -2.76% |
| 2014-15 | 94.93% -0.98% |
94.27% -1.08% |
95.54% -1.08% |
| 2015-16 | 94.92% -0.01% |
94.27% 0.02% |
95.56% 0.02% |
| 2016-17 | 94.07% -0.85% |
93.59% -1.02% |
94.54% -1.02% |
| 2017-18 | 94.12% 0.04% |
94.15% -0.46% |
94.08% -0.46% |
| 2018-19 | 93.40% -0.72% |
92.10% 0.55% |
94.63% 0.55% |
| 2019-20 | 95.37% 1.97% |
95.36% 0.76% |
95.39% 0.76% |
| 2020-21 | 94.15% -1.23% |
94.33% -0.36% |
95.03% -0.36% |
| 2021-22 | 96.00% 1.85% |
94.99% 0.97% |
96.00% 0.97% |
| 2022-23 | 95.14% -0.86% |
94.54% -0.35% |
95.65% -0.35% |
| Average | 95.18% | 94.68% | 95.68% |