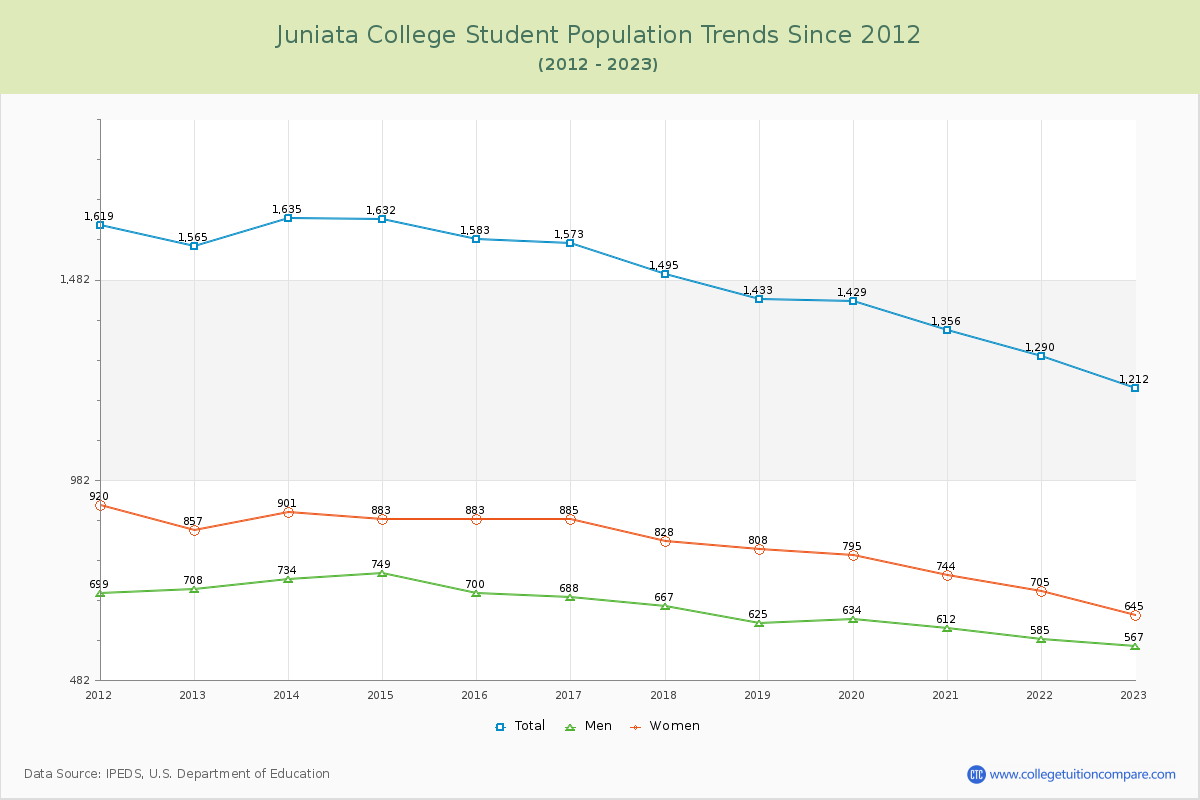
Student Population Changes
The average student population over the last 12 years is 1,473 where 1,212 students are attending the school for the academic year 2022-2023.
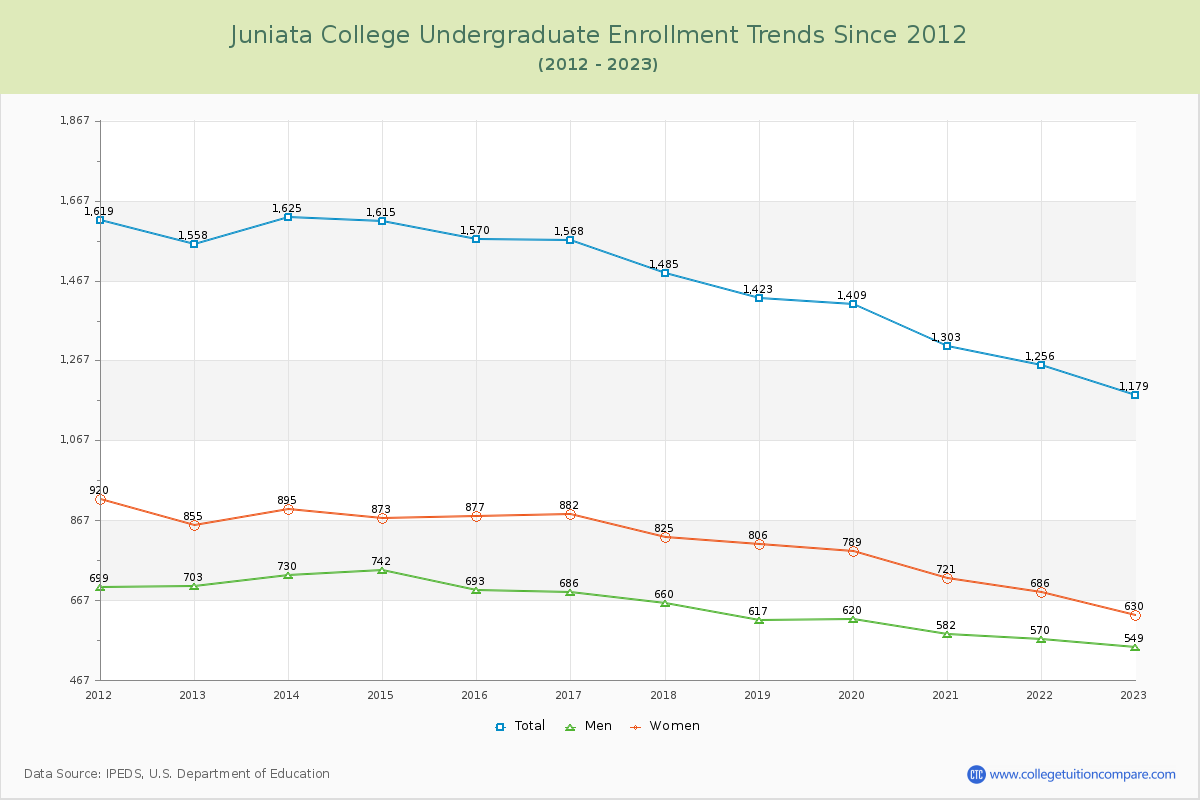
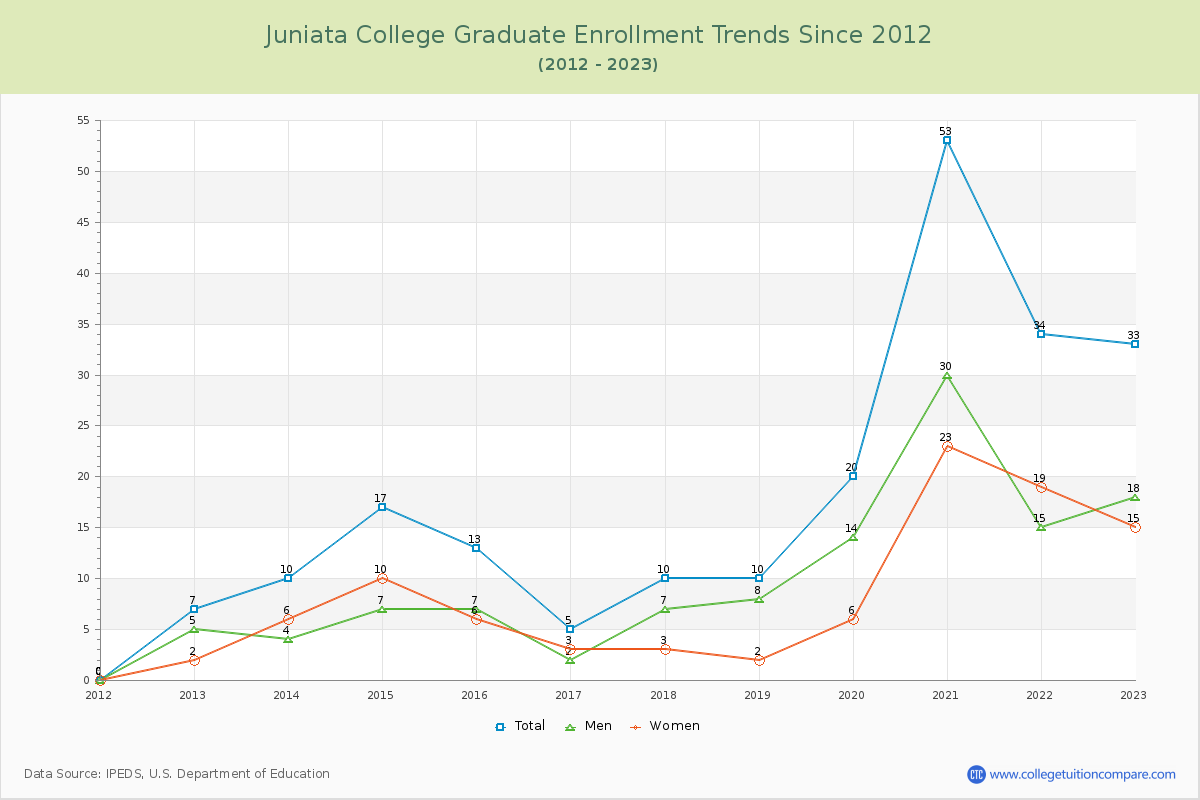
97.28% of total students is undergraduate students and 2.72% students is graduate students. The number of undergraduate students has decreased by 379 and the graduate enrollment has increased by 26 over past 10 years.
The female to male ratio is 1.14 to 1 and it means that there are slightly more female students enrolled in Juniata than male students.
The following table and chart illustrate the changes in student population by gender at Juniata College since 2012.
| Year | Total | Undergraduate | Graduate | ||||
|---|---|---|---|---|---|---|---|
| Total | Men | Women | Total | Men | Women | ||
| 2012-13 | 1,565 | 1,558 | 703 | 855 | 7 | 5 | 2 |
| 2013-14 | 1,635 70 | 1,625 67 | 730 27 | 895 40 | 10 3 | 4 -1 | 6 4 |
| 2014-15 | 1,632 -3 | 1,615 -10 | 742 12 | 873 -22 | 17 7 | 7 3 | 10 4 |
| 2015-16 | 1,583 -49 | 1,570 -45 | 693 -49 | 877 4 | 13 -4 | 7 0 | 6 -4 |
| 2016-17 | 1,573 -10 | 1,568 -2 | 686 -7 | 882 5 | 5 -8 | 2 -5 | 3 -3 |
| 2017-18 | 1,495 -78 | 1,485 -83 | 660 -26 | 825 -57 | 10 5 | 7 5 | 3 0 |
| 2018-19 | 1,433 -62 | 1,423 -62 | 617 -43 | 806 -19 | 10 0 | 8 1 | 2 -1 |
| 2019-20 | 1,429 -4 | 1,409 -14 | 620 3 | 789 -17 | 20 10 | 14 6 | 6 4 |
| 2020-21 | 1,356 -73 | 1,303 -106 | 582 -38 | 721 -68 | 53 33 | 30 16 | 23 17 |
| 2021-22 | 1,290 -66 | 1,256 -47 | 570 -12 | 686 -35 | 34 -19 | 15 -15 | 19 -4 |
| 2022-23 | 1,212 -78 | 1,179 -77 | 549 -21 | 630 -56 | 33 -1 | 18 3 | 15 -4 |
| Average | 1,473 | 1,454 | 650 | 804 | 19 | 11 | 9 |