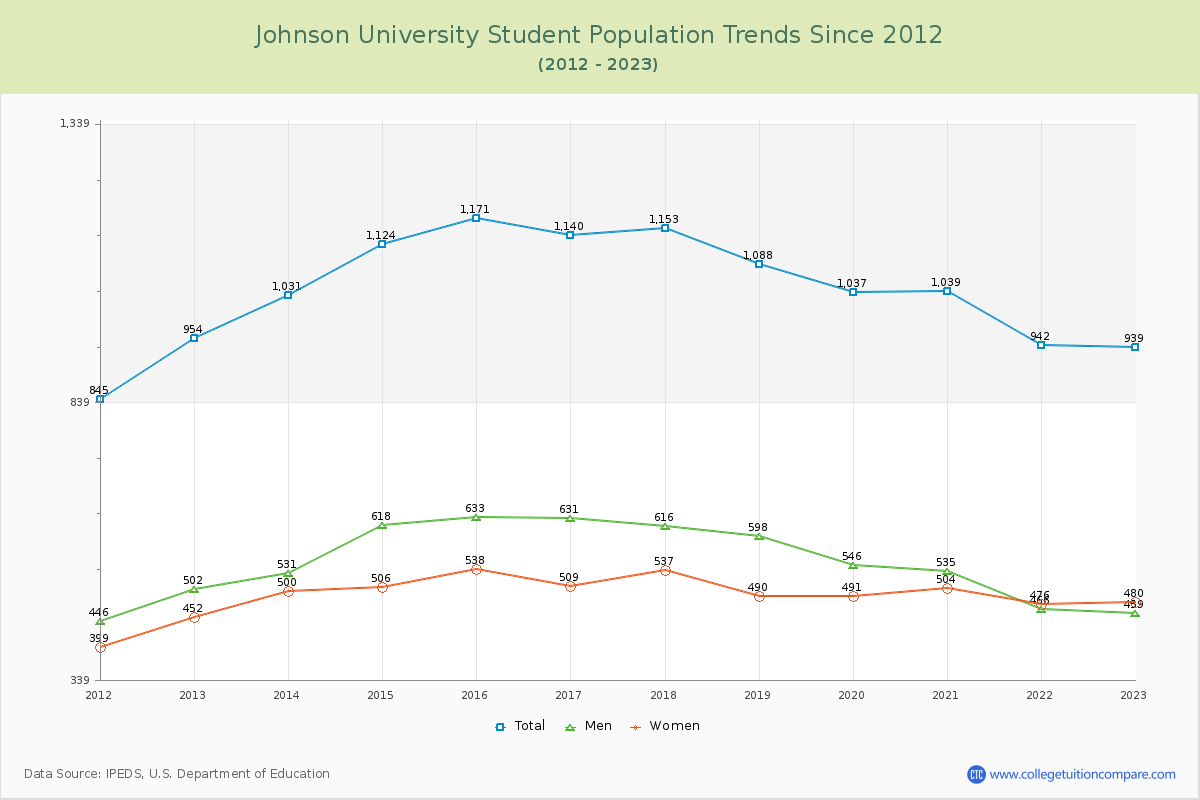
Student Population Changes
The average student population over the last 12 years is 1,056 where 939 students are attending the school for the academic year 2022-2023.
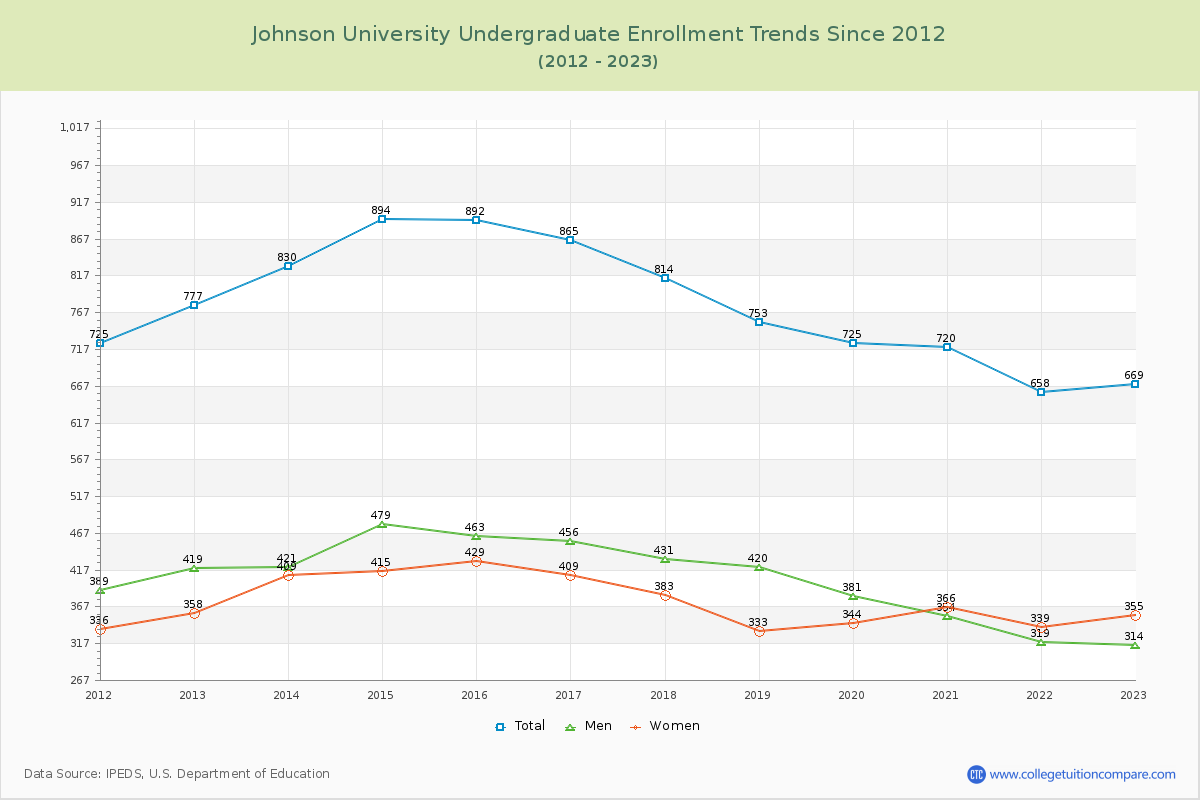
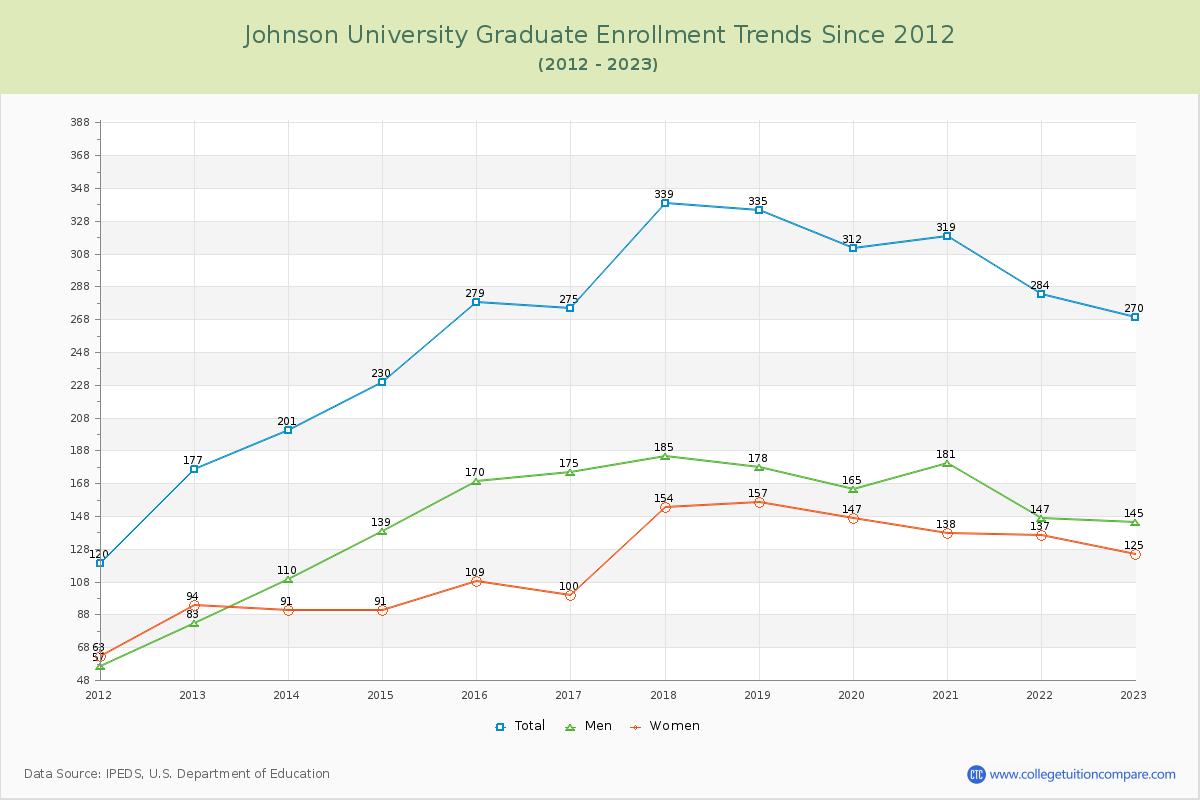
71.25% of total students is undergraduate students and 28.75% students is graduate students. The number of undergraduate students has decreased by 108 and the graduate enrollment has increased by 93 over past 10 years.
The female to male ratio is 1.05 to 1 and it means that there are similar numbers of female and male students enrolled in Johnson.
The following table and chart illustrate the changes in student population by gender at Johnson University since 2012.
| Year | Total | Undergraduate | Graduate | ||||
|---|---|---|---|---|---|---|---|
| Total | Men | Women | Total | Men | Women | ||
| 2012-13 | 954 | 777 | 419 | 358 | 177 | 83 | 94 |
| 2013-14 | 1,031 77 | 830 53 | 421 2 | 409 51 | 201 24 | 110 27 | 91 -3 |
| 2014-15 | 1,124 93 | 894 64 | 479 58 | 415 6 | 230 29 | 139 29 | 91 0 |
| 2015-16 | 1,171 47 | 892 -2 | 463 -16 | 429 14 | 279 49 | 170 31 | 109 18 |
| 2016-17 | 1,140 -31 | 865 -27 | 456 -7 | 409 -20 | 275 -4 | 175 5 | 100 -9 |
| 2017-18 | 1,153 13 | 814 -51 | 431 -25 | 383 -26 | 339 64 | 185 10 | 154 54 |
| 2018-19 | 1,088 -65 | 753 -61 | 420 -11 | 333 -50 | 335 -4 | 178 -7 | 157 3 |
| 2019-20 | 1,037 -51 | 725 -28 | 381 -39 | 344 11 | 312 -23 | 165 -13 | 147 -10 |
| 2020-21 | 1,039 2 | 720 -5 | 354 -27 | 366 22 | 319 7 | 181 16 | 138 -9 |
| 2021-22 | 942 -97 | 658 -62 | 319 -35 | 339 -27 | 284 -35 | 147 -34 | 137 -1 |
| 2022-23 | 939 -3 | 669 11 | 314 -5 | 355 16 | 270 -14 | 145 -2 | 125 -12 |
| Average | 1,056 | 782 | 405 | 376 | 275 | 153 | 122 |