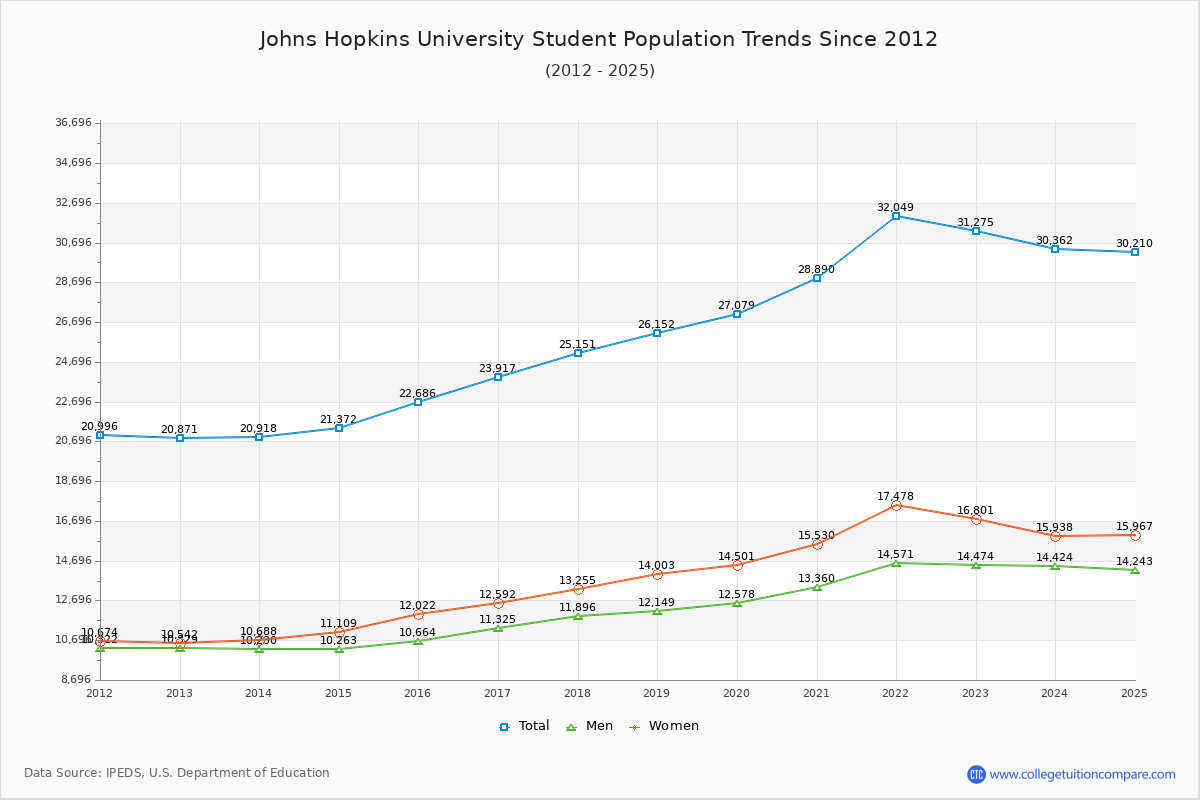
Student Population Changes
The average student population over the last 12 years is 25,487 where 31,275 students are attending the school for the academic year 2022-2023.
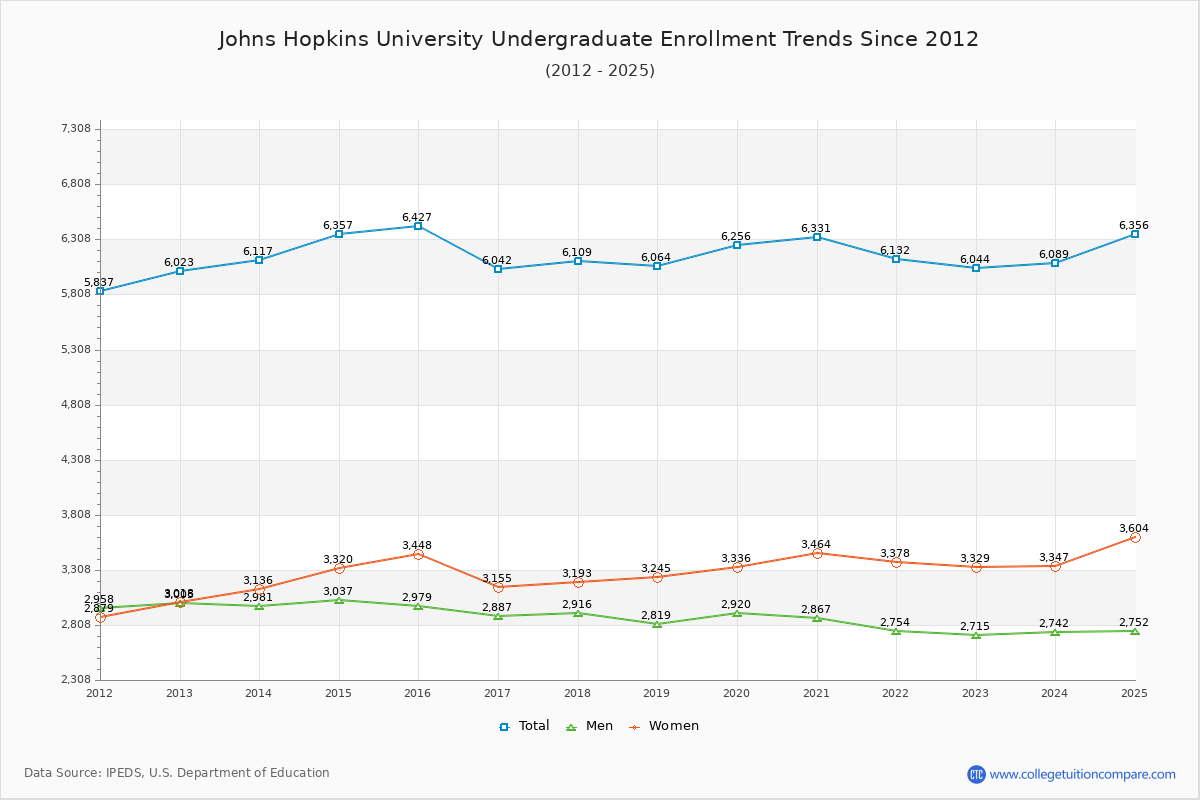
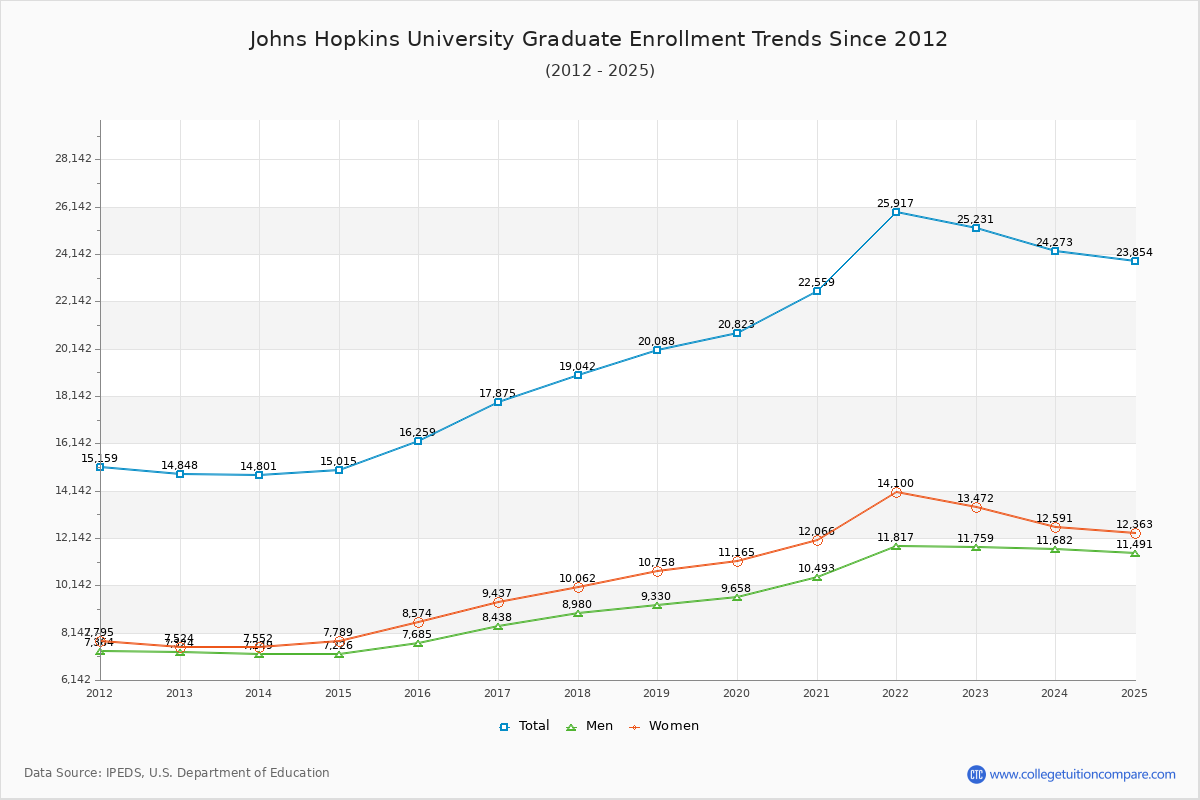
19.33% of total students is undergraduate students and 80.67% students is graduate students. The number of undergraduate students has increased by 21 and the graduate enrollment has increased by 10,383 over past 10 years.
The female to male ratio is 1.16 to 1 and it means that there are slightly more female students enrolled in Johns Hopkins than male students.
The following table and chart illustrate the changes in student population by gender at Johns Hopkins University since 2012.
| Year | Total | Undergraduate | Graduate | ||||
|---|---|---|---|---|---|---|---|
| Total | Men | Women | Total | Men | Women | ||
| 2012-13 | 20,871 | 6,023 | 3,005 | 3,018 | 14,848 | 7,324 | 7,524 |
| 2013-14 | 20,918 47 | 6,117 94 | 2,981 -24 | 3,136 118 | 14,801 -47 | 7,249 -75 | 7,552 28 |
| 2014-15 | 21,372 454 | 6,357 240 | 3,037 56 | 3,320 184 | 15,015 214 | 7,226 -23 | 7,789 237 |
| 2015-16 | 22,686 1,314 | 6,427 70 | 2,979 -58 | 3,448 128 | 16,259 1,244 | 7,685 459 | 8,574 785 |
| 2016-17 | 23,917 1,231 | 6,042 -385 | 2,887 -92 | 3,155 -293 | 17,875 1,616 | 8,438 753 | 9,437 863 |
| 2017-18 | 25,151 1,234 | 6,109 67 | 2,916 29 | 3,193 38 | 19,042 1,167 | 8,980 542 | 10,062 625 |
| 2018-19 | 26,152 1,001 | 6,064 -45 | 2,819 -97 | 3,245 52 | 20,088 1,046 | 9,330 350 | 10,758 696 |
| 2019-20 | 27,079 927 | 6,256 192 | 2,920 101 | 3,336 91 | 20,823 735 | 9,658 328 | 11,165 407 |
| 2020-21 | 28,890 1,811 | 6,331 75 | 2,867 -53 | 3,464 128 | 22,559 1,736 | 10,493 835 | 12,066 901 |
| 2021-22 | 32,049 3,159 | 6,132 -199 | 2,754 -113 | 3,378 -86 | 25,917 3,358 | 11,817 1,324 | 14,100 2,034 |
| 2022-23 | 31,275 -774 | 6,044 -88 | 2,715 -39 | 3,329 -49 | 25,231 -686 | 11,759 -58 | 13,472 -628 |
| Average | 25,487 | 6,173 | 2,898 | 3,275 | 19,314 | 9,087 | 10,227 |