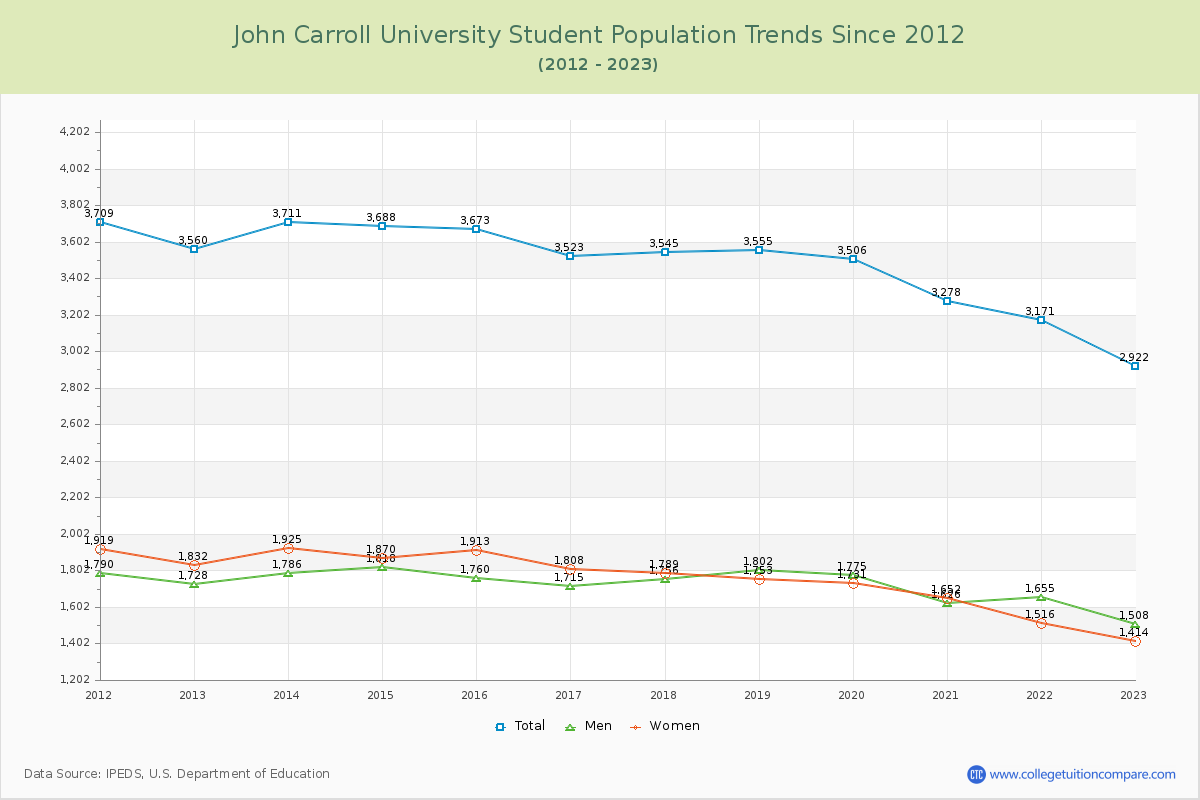
Student Population Changes
The average student population over the last 12 years is 3,467 where 2,922 students are attending the school for the academic year 2022-2023.
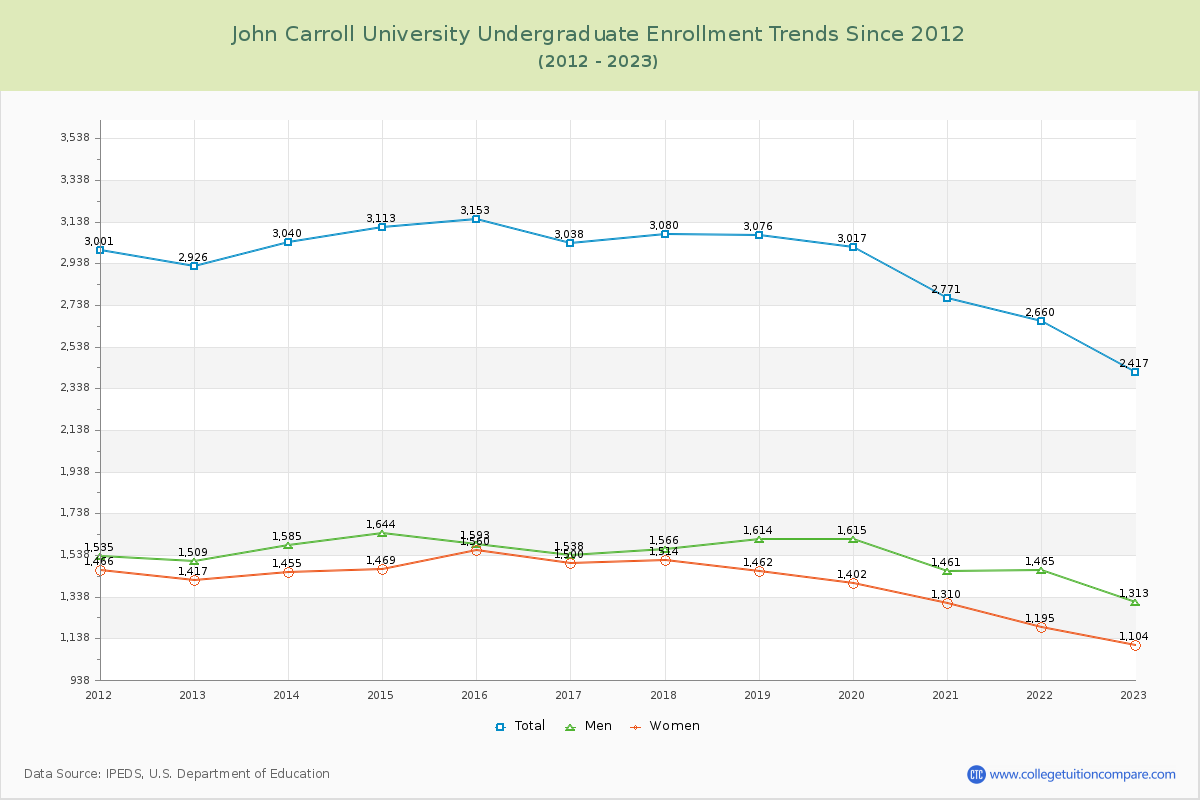
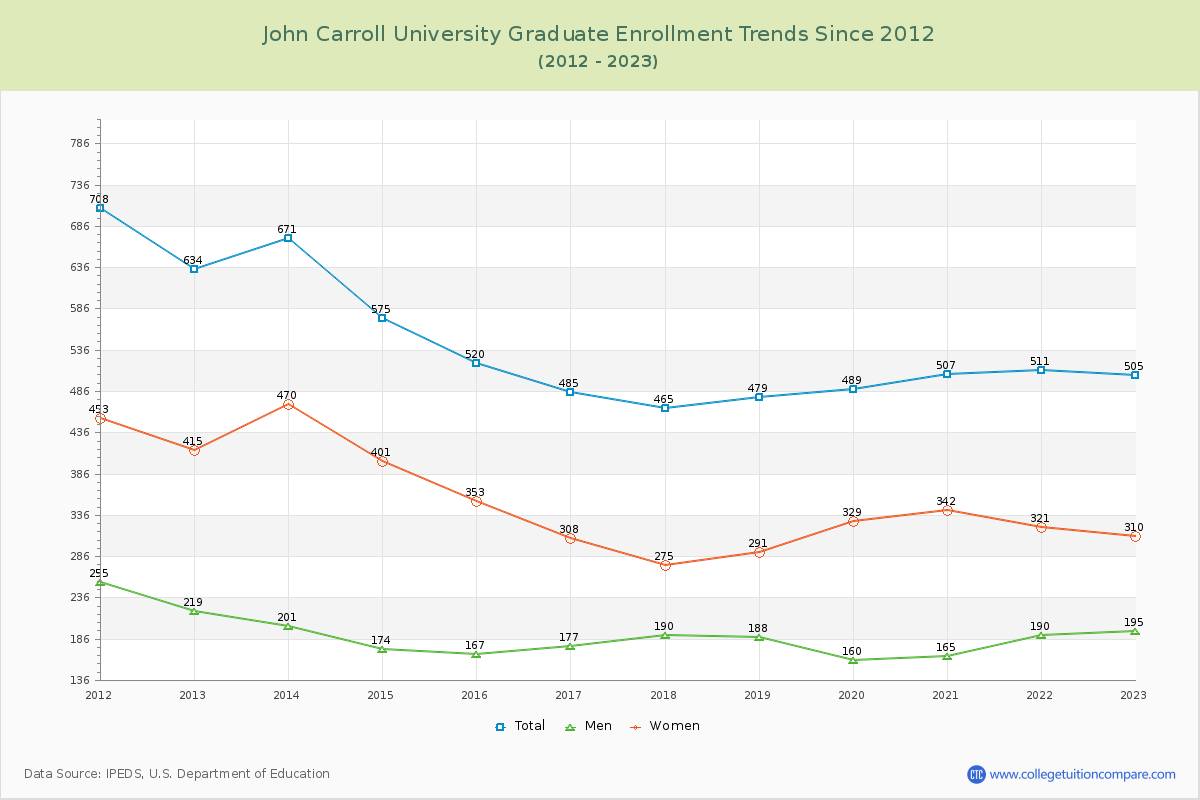
82.72% of total students is undergraduate students and 17.28% students is graduate students. The number of undergraduate students has decreased by 509 and the graduate enrollment has decreased by 129 over past 10 years.
The female to male ratio is 0.94 to 1 and it means that there are similar numbers of female and male students enrolled in JCU.
The following table and chart illustrate the changes in student population by gender at John Carroll University since 2012.
| Year | Total | Undergraduate | Graduate | ||||
|---|---|---|---|---|---|---|---|
| Total | Men | Women | Total | Men | Women | ||
| 2012-13 | 3,560 | 2,926 | 1,509 | 1,417 | 634 | 219 | 415 |
| 2013-14 | 3,711 151 | 3,040 114 | 1,585 76 | 1,455 38 | 671 37 | 201 -18 | 470 55 |
| 2014-15 | 3,688 -23 | 3,113 73 | 1,644 59 | 1,469 14 | 575 -96 | 174 -27 | 401 -69 |
| 2015-16 | 3,673 -15 | 3,153 40 | 1,593 -51 | 1,560 91 | 520 -55 | 167 -7 | 353 -48 |
| 2016-17 | 3,523 -150 | 3,038 -115 | 1,538 -55 | 1,500 -60 | 485 -35 | 177 10 | 308 -45 |
| 2017-18 | 3,545 22 | 3,080 42 | 1,566 28 | 1,514 14 | 465 -20 | 190 13 | 275 -33 |
| 2018-19 | 3,555 10 | 3,076 -4 | 1,614 48 | 1,462 -52 | 479 14 | 188 -2 | 291 16 |
| 2019-20 | 3,506 -49 | 3,017 -59 | 1,615 1 | 1,402 -60 | 489 10 | 160 -28 | 329 38 |
| 2020-21 | 3,278 -228 | 2,771 -246 | 1,461 -154 | 1,310 -92 | 507 18 | 165 5 | 342 13 |
| 2021-22 | 3,171 -107 | 2,660 -111 | 1,465 4 | 1,195 -115 | 511 4 | 190 25 | 321 -21 |
| 2022-23 | 2,922 -249 | 2,417 -243 | 1,313 -152 | 1,104 -91 | 505 -6 | 195 5 | 310 -11 |
| Average | 3,467 | 2,936 | 1,537 | 1,399 | 531 | 184 | 347 |