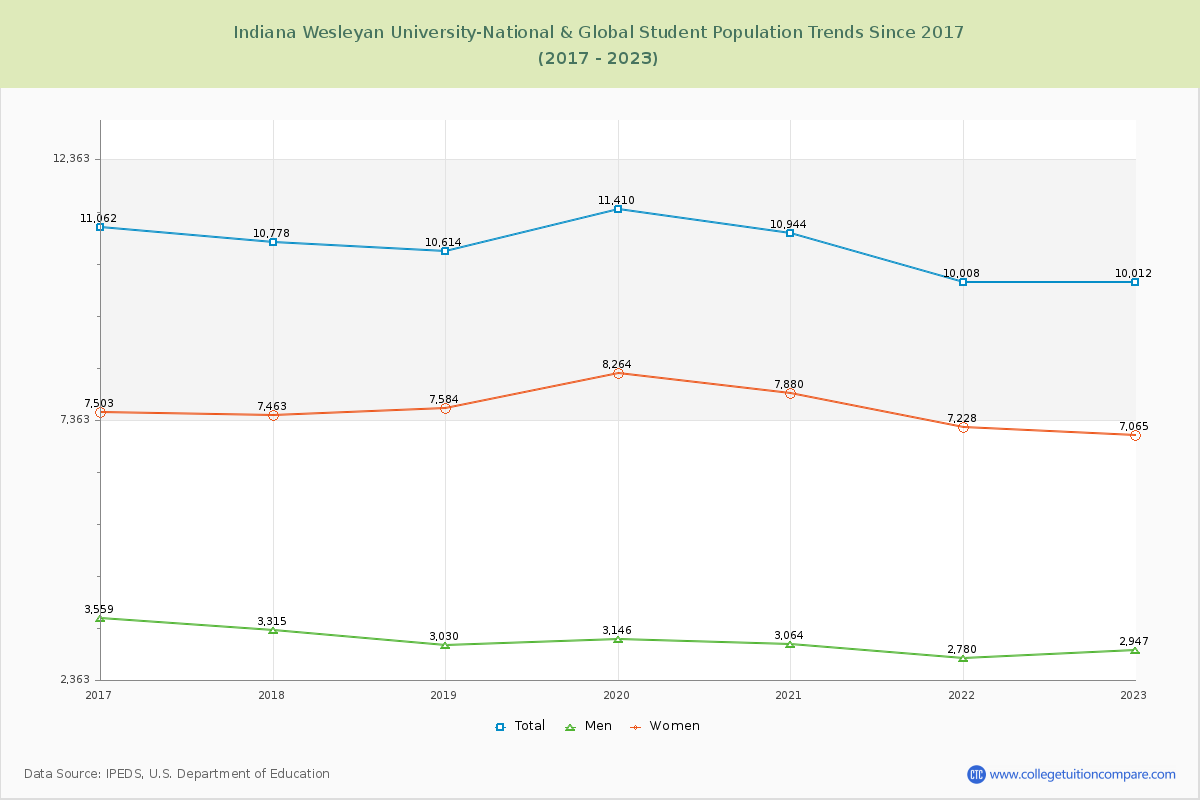
Student Population Changes
The average student population over the last 8 years is 10,690 where 10,012 students are attending the school for the academic year 2022-2023.
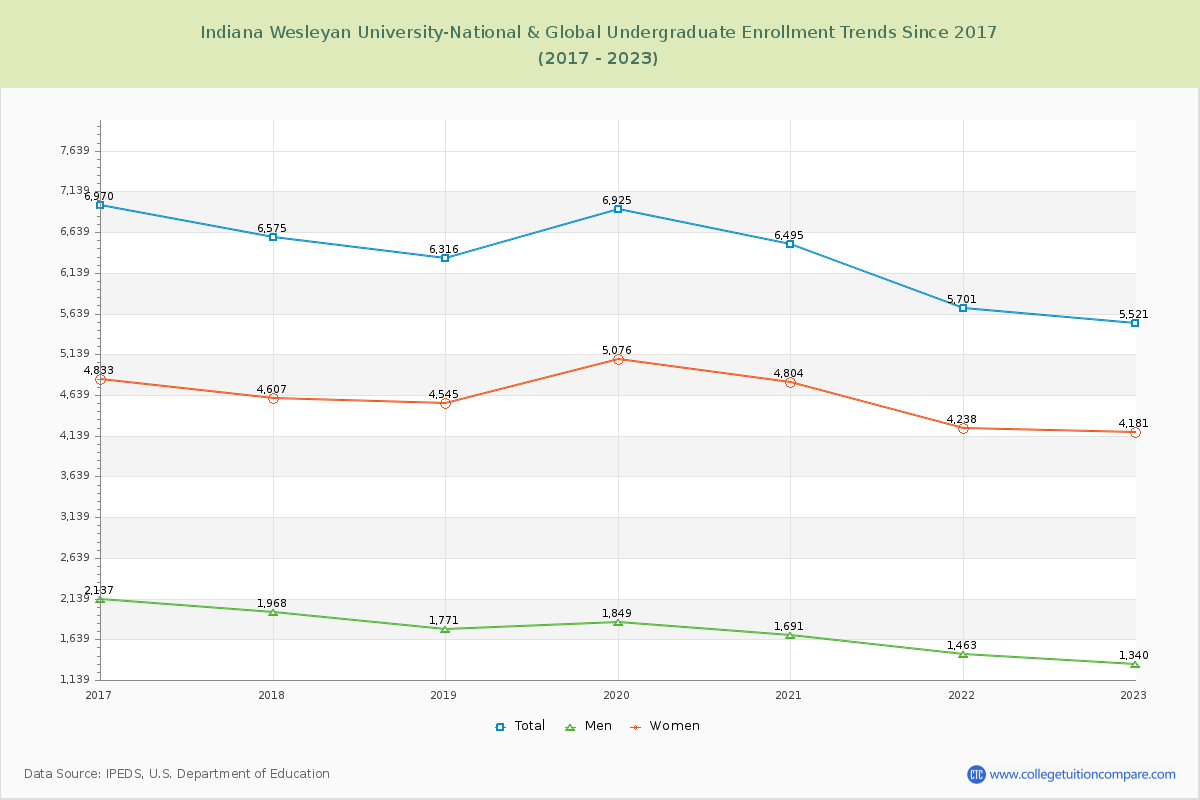
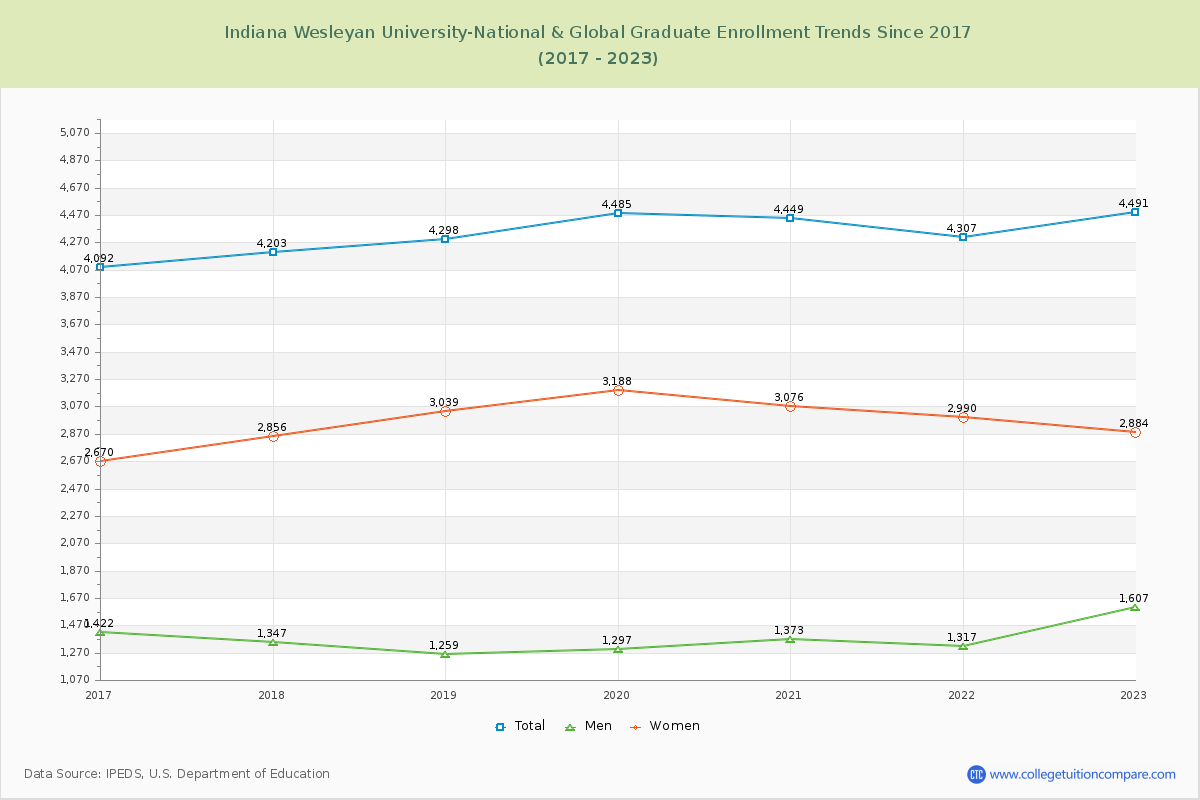
55.14% of total students is undergraduate students and 44.86% students is graduate students. The number of undergraduate students has decreased by 1,449 and the graduate enrollment has increased by 399 over past 10 years.
The female to male ratio is 2.40 to 1 and it means that there are far more female students enrolled in IWU than male students.
The following table and chart illustrate the changes in student population by gender at Indiana Wesleyan University-National & Global since 2016.
| Year | Total | Undergraduate | Graduate | ||||
|---|---|---|---|---|---|---|---|
| Total | Men | Women | Total | Men | Women | ||
| 2016-17 | 11,062 | 6,970 | 2,137 | 4,833 | 4,092 | 1,422 | 2,670 |
| 2017-18 | 10,778 -284 | 6,575 -395 | 1,968 -169 | 4,607 -226 | 4,203 111 | 1,347 -75 | 2,856 186 |
| 2018-19 | 10,614 -164 | 6,316 -259 | 1,771 -197 | 4,545 -62 | 4,298 95 | 1,259 -88 | 3,039 183 |
| 2019-20 | 11,410 796 | 6,925 609 | 1,849 78 | 5,076 531 | 4,485 187 | 1,297 38 | 3,188 149 |
| 2020-21 | 10,944 -466 | 6,495 -430 | 1,691 -158 | 4,804 -272 | 4,449 -36 | 1,373 76 | 3,076 -112 |
| 2021-22 | 10,008 -936 | 5,701 -794 | 1,463 -228 | 4,238 -566 | 4,307 -142 | 1,317 -56 | 2,990 -86 |
| 2022-23 | 10,012 4 | 5,521 -180 | 1,340 -123 | 4,181 -57 | 4,491 184 | 1,607 290 | 2,884 -106 |
| Average | 10,690 | 6,358 | 1,746 | 4,612 | 4,332 | 1,375 | 2,958 |