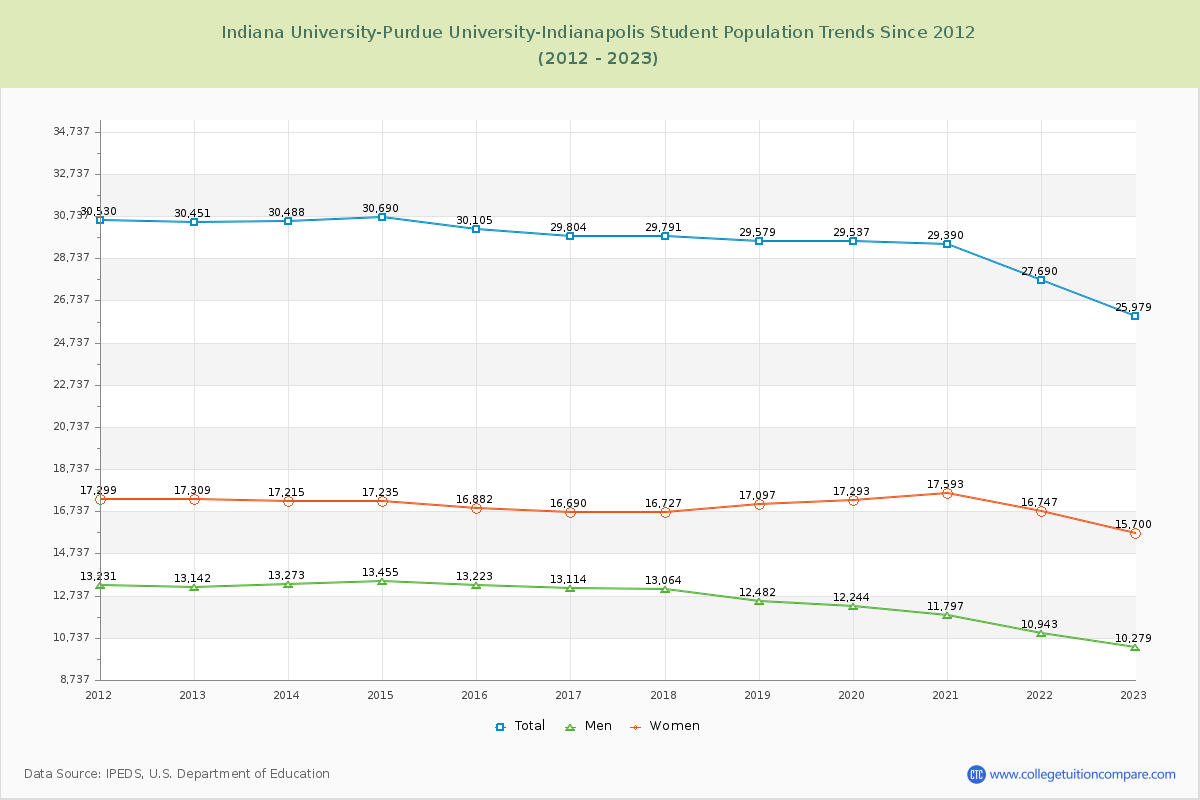
Student Population Changes
The average student population over the last 12 years is 29,409 where 25,979 students are attending the school for the academic year 2022-2023.
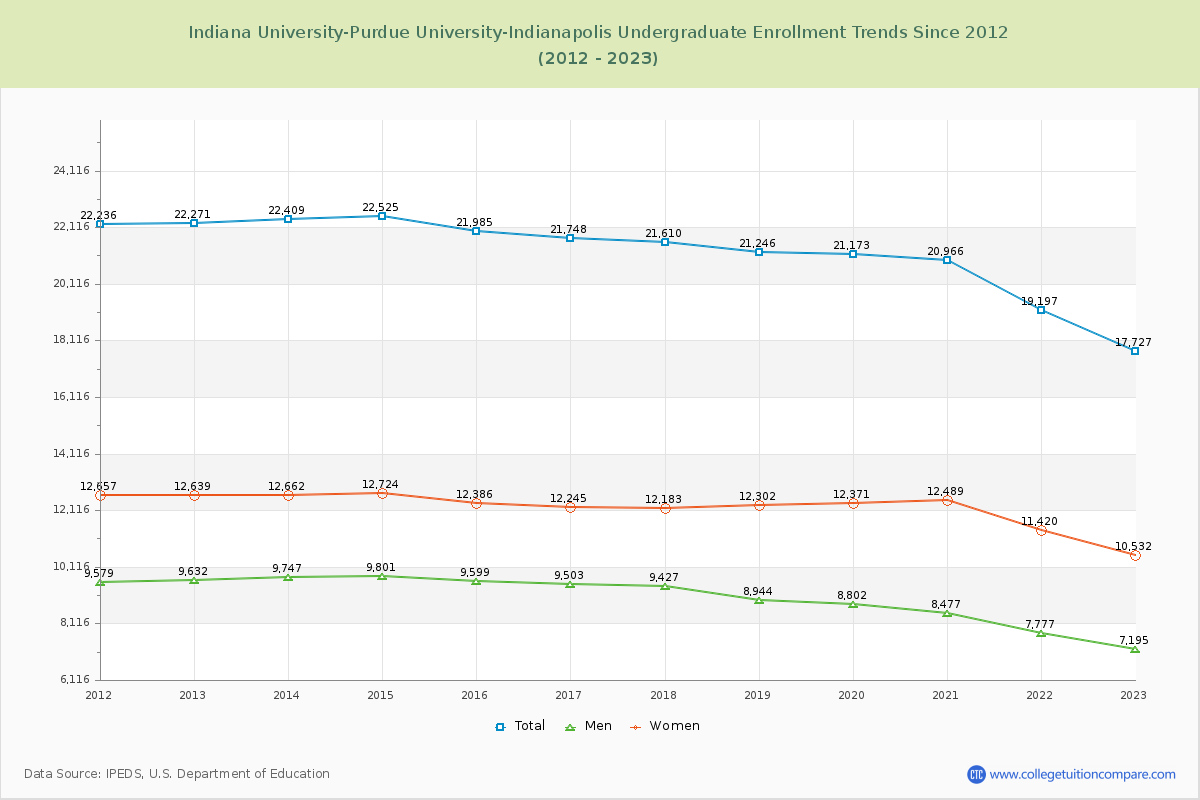
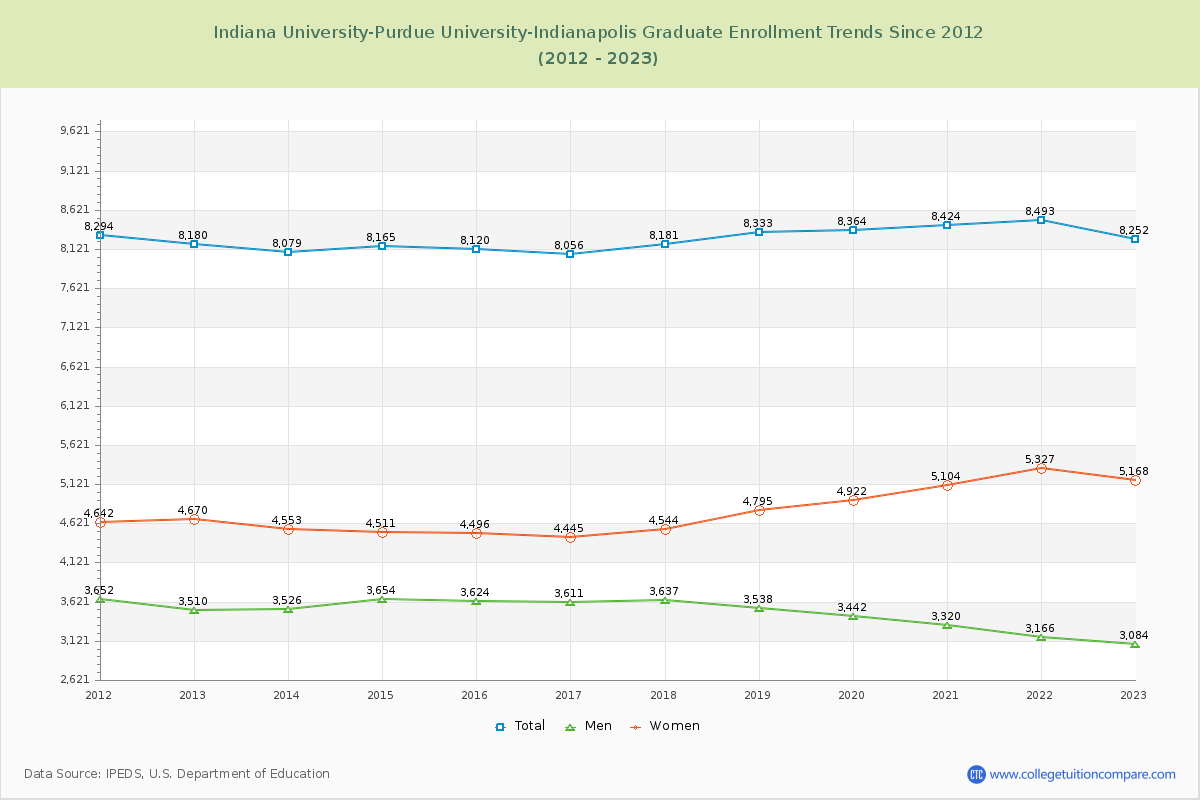
68.24% of total students is undergraduate students and 31.76% students is graduate students. The number of undergraduate students has decreased by 4,544 and the graduate enrollment has increased by 72 over past 10 years.
The female to male ratio is 1.53 to 1 and it means that there are more female students enrolled in IUPUI than male students.
The following table and chart illustrate the changes in student population by gender at Indiana University-Purdue University-Indianapolis since 2012.
| Year | Total | Undergraduate | Graduate | ||||
|---|---|---|---|---|---|---|---|
| Total | Men | Women | Total | Men | Women | ||
| 2012-13 | 30,451 | 22,271 | 9,632 | 12,639 | 8,180 | 3,510 | 4,670 |
| 2013-14 | 30,488 37 | 22,409 138 | 9,747 115 | 12,662 23 | 8,079 -101 | 3,526 16 | 4,553 -117 |
| 2014-15 | 30,690 202 | 22,525 116 | 9,801 54 | 12,724 62 | 8,165 86 | 3,654 128 | 4,511 -42 |
| 2015-16 | 30,105 -585 | 21,985 -540 | 9,599 -202 | 12,386 -338 | 8,120 -45 | 3,624 -30 | 4,496 -15 |
| 2016-17 | 29,804 -301 | 21,748 -237 | 9,503 -96 | 12,245 -141 | 8,056 -64 | 3,611 -13 | 4,445 -51 |
| 2017-18 | 29,791 -13 | 21,610 -138 | 9,427 -76 | 12,183 -62 | 8,181 125 | 3,637 26 | 4,544 99 |
| 2018-19 | 29,579 -212 | 21,246 -364 | 8,944 -483 | 12,302 119 | 8,333 152 | 3,538 -99 | 4,795 251 |
| 2019-20 | 29,537 -42 | 21,173 -73 | 8,802 -142 | 12,371 69 | 8,364 31 | 3,442 -96 | 4,922 127 |
| 2020-21 | 29,390 -147 | 20,966 -207 | 8,477 -325 | 12,489 118 | 8,424 60 | 3,320 -122 | 5,104 182 |
| 2021-22 | 27,690 -1,700 | 19,197 -1,769 | 7,777 -700 | 11,420 -1,069 | 8,493 69 | 3,166 -154 | 5,327 223 |
| 2022-23 | 25,979 -1,711 | 17,727 -1,470 | 7,195 -582 | 10,532 -888 | 8,252 -241 | 3,084 -82 | 5,168 -159 |
| Average | 29,409 | 21,169 | 8,991 | 12,178 | 8,241 | 3,465 | 4,776 |