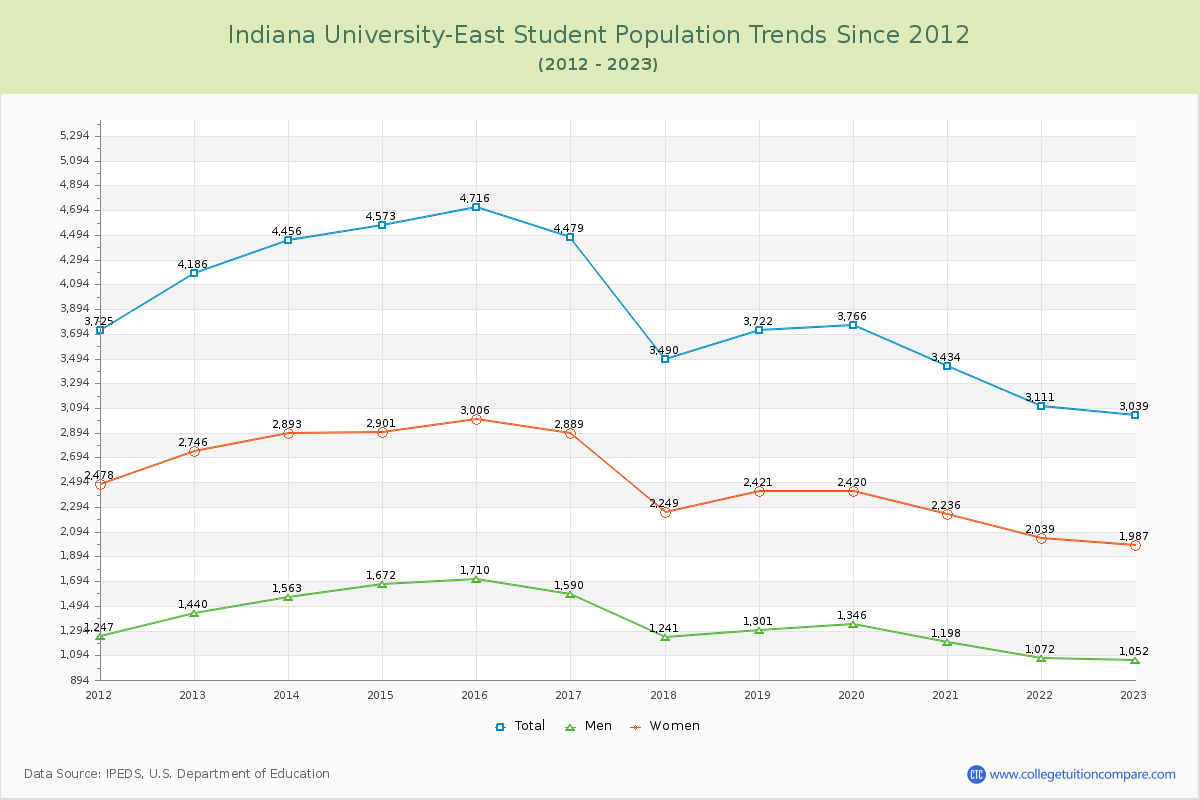
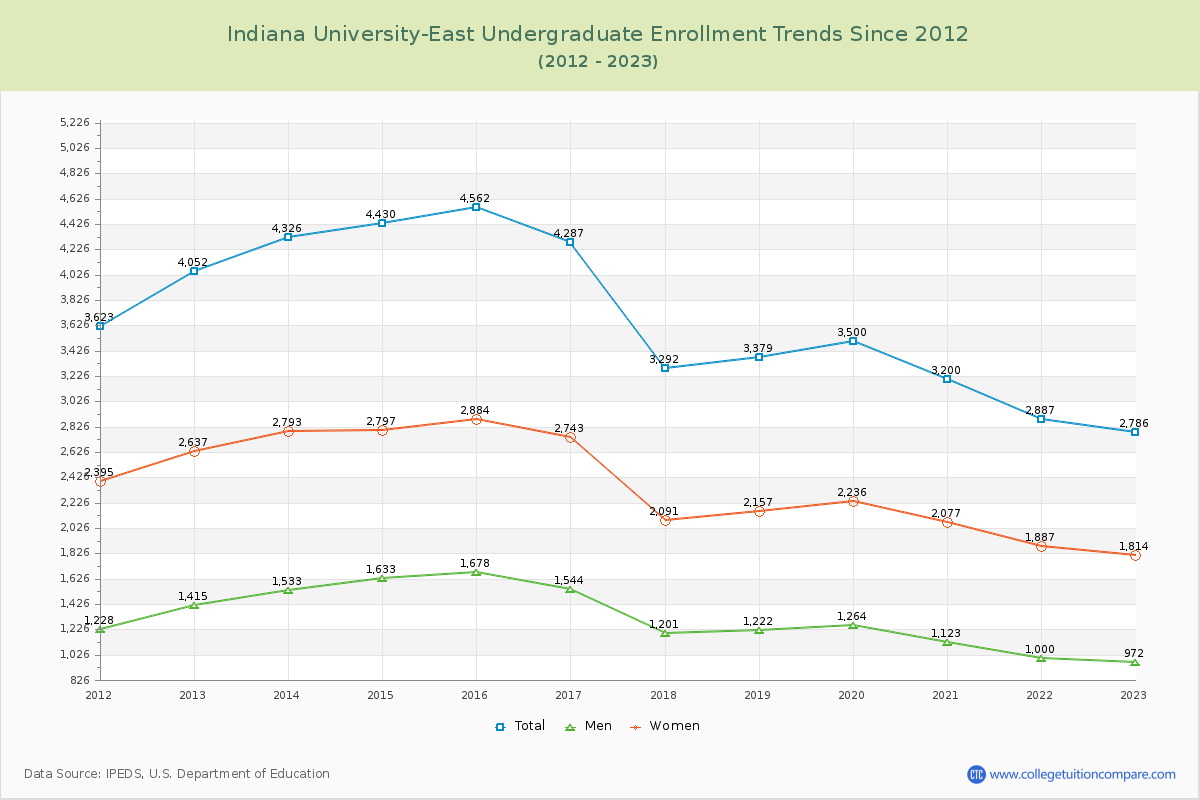
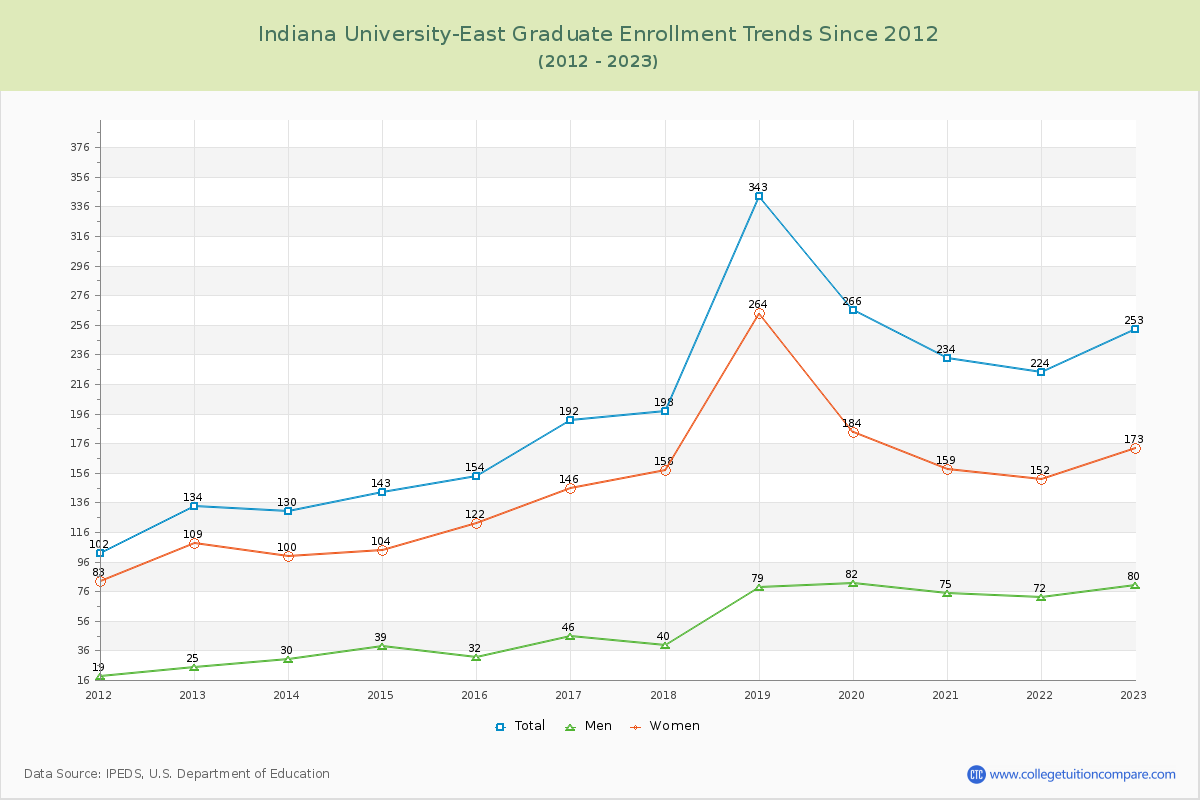
Student Population Changes
The average student population over the last 12 years is 3,907 where 3,039 students are attending the school for the academic year 2022-2023.
91.67% of total students is undergraduate students and 8.33% students is graduate students. The number of undergraduate students has decreased by 1,266 and the graduate enrollment has increased by 119 over past 10 years.
The female to male ratio is 1.89 to 1 and it means that there are more female students enrolled in IUE than male students.
The following table and chart illustrate the changes in student population by gender at Indiana University-East since 2012.
| Year | Total | Undergraduate | Graduate | ||||
|---|---|---|---|---|---|---|---|
| Total | Men | Women | Total | Men | Women | ||
| 2012-13 | 4,186 | 4,052 | 1,415 | 2,637 | 134 | 25 | 109 |
| 2013-14 | 4,456 270 | 4,326 274 | 1,533 118 | 2,793 156 | 130 -4 | 30 5 | 100 -9 |
| 2014-15 | 4,573 117 | 4,430 104 | 1,633 100 | 2,797 4 | 143 13 | 39 9 | 104 4 |
| 2015-16 | 4,716 143 | 4,562 132 | 1,678 45 | 2,884 87 | 154 11 | 32 -7 | 122 18 |
| 2016-17 | 4,479 -237 | 4,287 -275 | 1,544 -134 | 2,743 -141 | 192 38 | 46 14 | 146 24 |
| 2017-18 | 3,490 -989 | 3,292 -995 | 1,201 -343 | 2,091 -652 | 198 6 | 40 -6 | 158 12 |
| 2018-19 | 3,722 232 | 3,379 87 | 1,222 21 | 2,157 66 | 343 145 | 79 39 | 264 106 |
| 2019-20 | 3,766 44 | 3,500 121 | 1,264 42 | 2,236 79 | 266 -77 | 82 3 | 184 -80 |
| 2020-21 | 3,434 -332 | 3,200 -300 | 1,123 -141 | 2,077 -159 | 234 -32 | 75 -7 | 159 -25 |
| 2021-22 | 3,111 -323 | 2,887 -313 | 1,000 -123 | 1,887 -190 | 224 -10 | 72 -3 | 152 -7 |
| 2022-23 | 3,039 -72 | 2,786 -101 | 972 -28 | 1,814 -73 | 253 29 | 80 8 | 173 21 |
| Average | 3,907 | 3,700 | 1,326 | 2,374 | 206 | 55 | 152 |