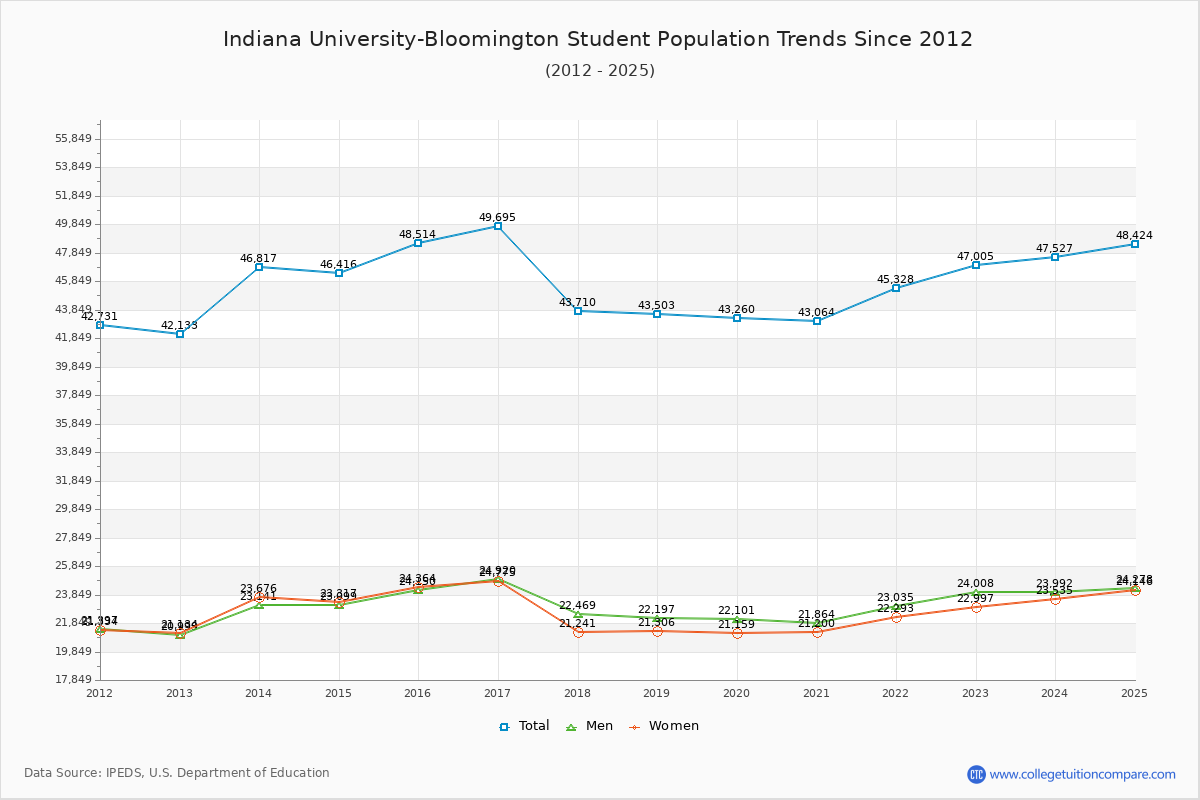
Student Population Changes
The average student population over the last 12 years is 45,404 where 47,005 students are attending the school for the academic year 2022-2023.
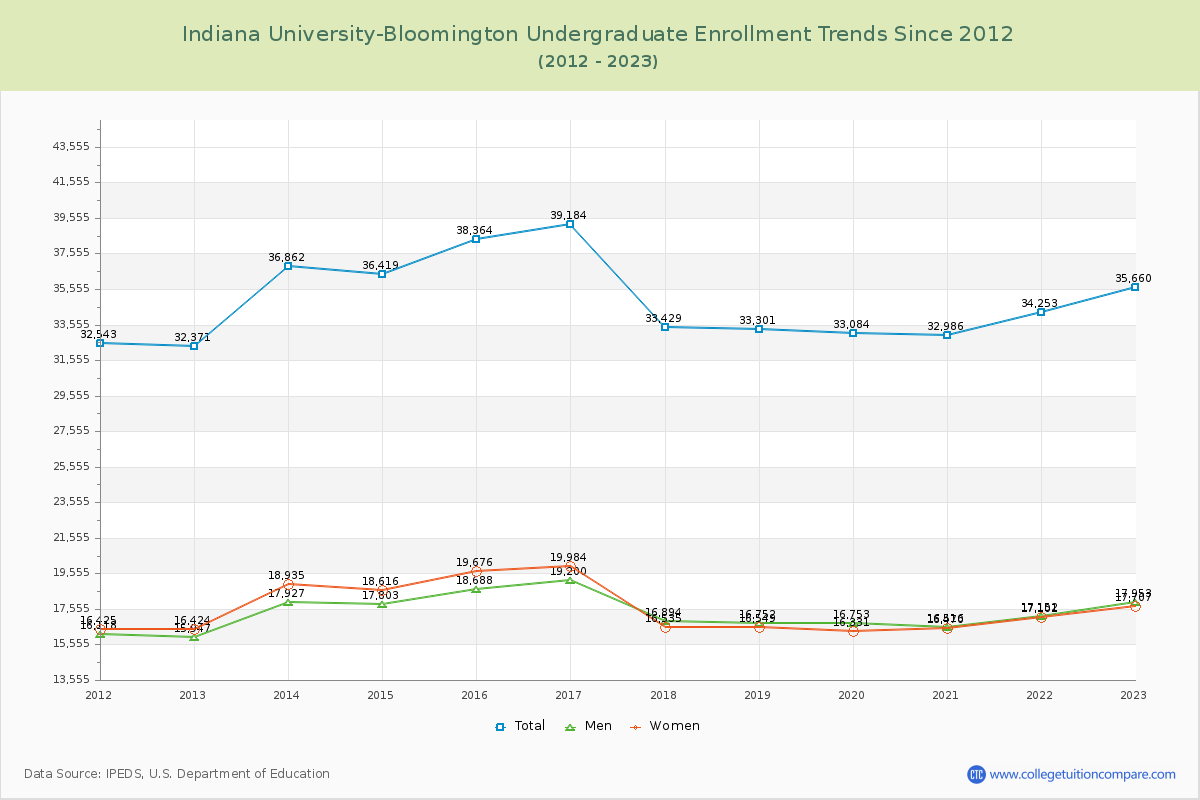
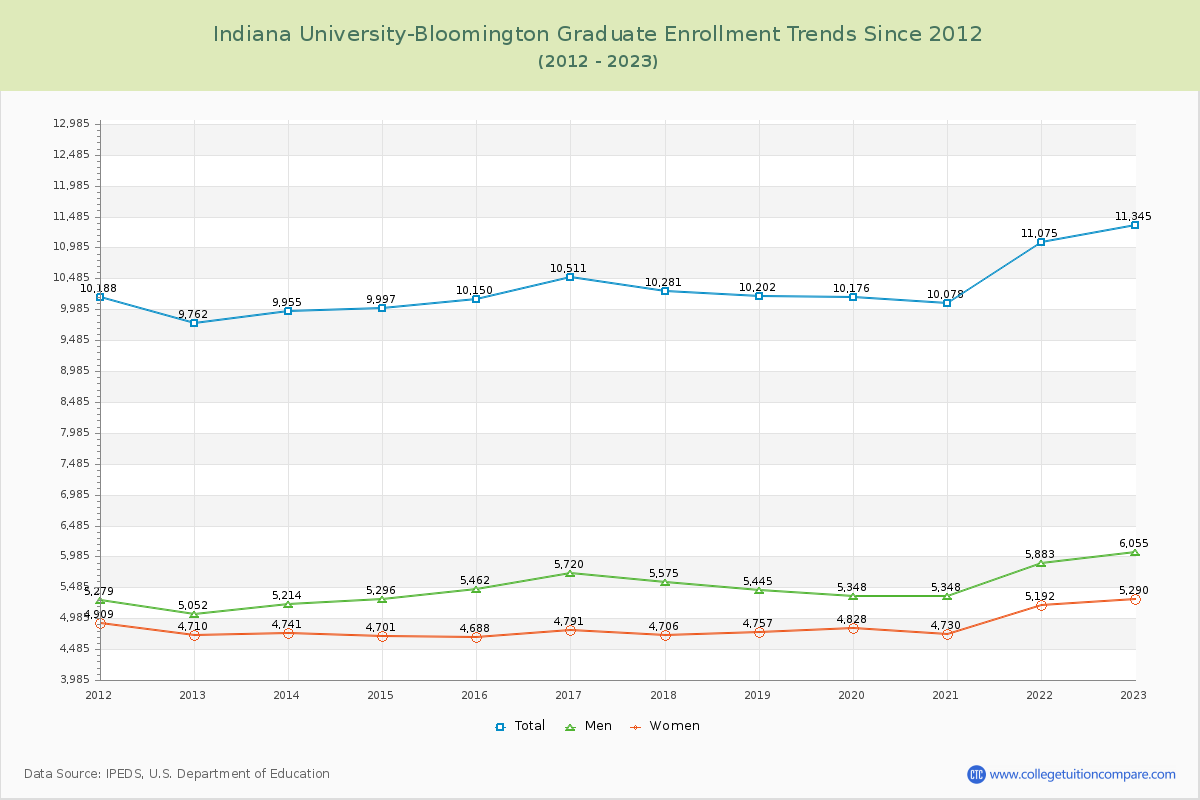
75.86% of total students is undergraduate students and 24.14% students is graduate students. The number of undergraduate students has increased by 3,289 and the graduate enrollment has increased by 1,583 over past 10 years.
The female to male ratio is 0.96 to 1 and it means that there are similar numbers of female and male students enrolled in IU.
The following table and chart illustrate the changes in student population by gender at Indiana University-Bloomington since 2012.
| Year | Total | Undergraduate | Graduate | ||||
|---|---|---|---|---|---|---|---|
| Total | Men | Women | Total | Men | Women | ||
| 2012-13 | 42,133 | 32,371 | 15,947 | 16,424 | 9,762 | 5,052 | 4,710 |
| 2013-14 | 46,817 4,684 | 36,862 4,491 | 17,927 1,980 | 18,935 2,511 | 9,955 193 | 5,214 162 | 4,741 31 |
| 2014-15 | 46,416 -401 | 36,419 -443 | 17,803 -124 | 18,616 -319 | 9,997 42 | 5,296 82 | 4,701 -40 |
| 2015-16 | 48,514 2,098 | 38,364 1,945 | 18,688 885 | 19,676 1,060 | 10,150 153 | 5,462 166 | 4,688 -13 |
| 2016-17 | 49,695 1,181 | 39,184 820 | 19,200 512 | 19,984 308 | 10,511 361 | 5,720 258 | 4,791 103 |
| 2017-18 | 43,710 -5,985 | 33,429 -5,755 | 16,894 -2,306 | 16,535 -3,449 | 10,281 -230 | 5,575 -145 | 4,706 -85 |
| 2018-19 | 43,503 -207 | 33,301 -128 | 16,752 -142 | 16,549 14 | 10,202 -79 | 5,445 -130 | 4,757 51 |
| 2019-20 | 43,260 -243 | 33,084 -217 | 16,753 1 | 16,331 -218 | 10,176 -26 | 5,348 -97 | 4,828 71 |
| 2020-21 | 43,064 -196 | 32,986 -98 | 16,516 -237 | 16,470 139 | 10,078 -98 | 5,348 0 | 4,730 -98 |
| 2021-22 | 45,328 2,264 | 34,253 1,267 | 17,152 636 | 17,101 631 | 11,075 997 | 5,883 535 | 5,192 462 |
| 2022-23 | 47,005 1,677 | 35,660 1,407 | 17,953 801 | 17,707 606 | 11,345 270 | 6,055 172 | 5,290 98 |
| Average | 45,404 | 35,083 | 17,417 | 17,666 | 10,321 | 5,491 | 4,830 |